4 Model Networks
What are “typical” properties of “real” networks, and how can we model them mathematically?
Idea: suppose the network is “random” in some sense and compute expected behavior.
4.1 Network characteristics
The degree distribution \(p_d\) of a graph on \(V=\{1, \ldots, N\}\) is given by \[p_d = \dfrac{1}{N} \sum_{i=1}^N \delta_{d(i),d}\]
That is, \(p_d\) is the fraction of vertices of degree \(d\).
Notes:
For this section \(|V| = N\), and generally we assume \(N\) is large.
\(p_d = p(d)\) is really a function of \(d\), but it is common to write \(p_d\) for short, to mean both \(p\) and \(p(d)\).
\(p_d\) is a discrete probability distribution on \(\mathbb{N}\), since \(p_d \geq 0\) \(\forall d \in \mathbb{N}\) and \[\begin{aligned} \sum_{d=0}^{\infty} p_d &= \dfrac{1}{N} \sum_{i=1}^N \sum_{d=0}^{\infty} \delta_{d(i),d}\\ &= \dfrac{1}{N} \sum_{i=1}^N 1\\ &= 1. \end{aligned}\] If \(v\) is a vertex chosen uniformly at random from \(V\), then \[\mathbb{P}(d(v)=d) = p_d.\]
The mean degree \(d(G)\) is simply the mean of \(p_d\). It is traditional to use \(\langle \ldots \rangle\) for averaging, so \[d(G) = \langle d \rangle = \sum_d d p_d.\]
There is a collection of “real” networks available for research curated by the Stanford Network Analysis Project (SNAP).
Let’s look at a social network derived from the streaming platform Twitch. According to the description, “nodes are the users themselves and the links are mutual friendships between them.”
>> load twitch_network.mat
>> N=length(A);
>> d=full(sum(A));
>> Delta=max(d);
>> delta=min(d);
>> histogram(d,(delta:Delta),'Normalization','pdf');
>> axis([0 100 0 0.2]);
>> xlabel('d');
>> ylabel('p_d');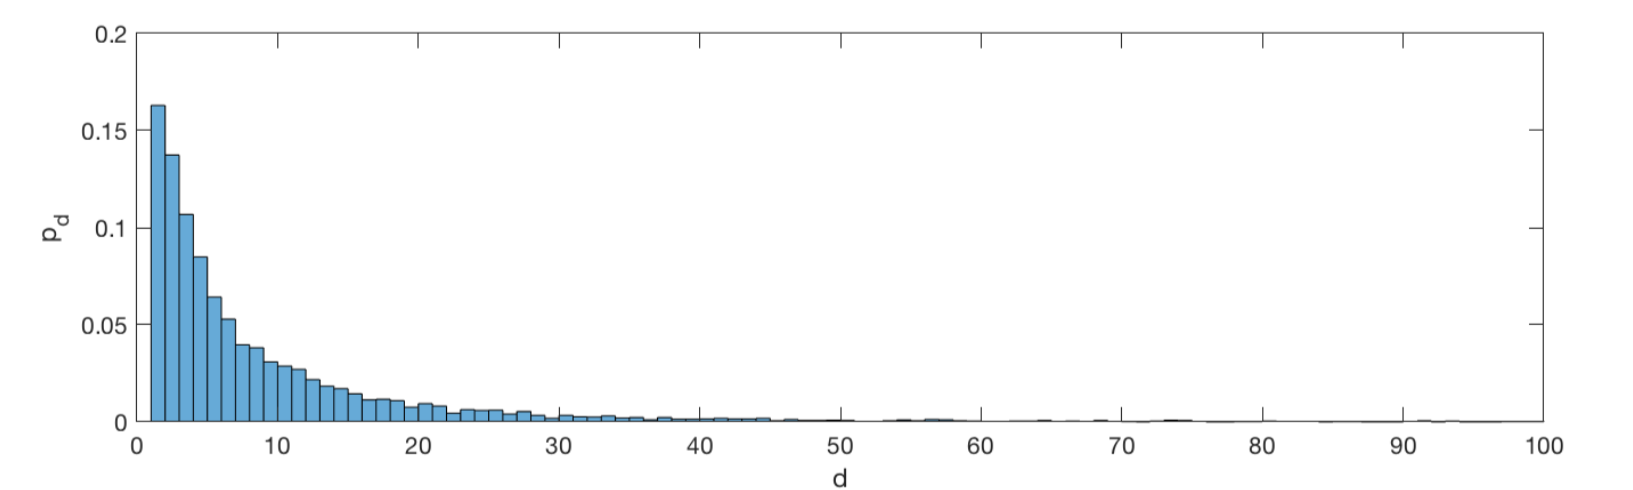
The average degree here is mean(d) = 9.9, meaning that the average number of friends is just less than ten.
Proof. \[\begin{aligned} \mathbb{P}(d(u)=d) &= \sum_{i,j} \mathbb{P}(e=ij) \delta_{d(i),d}\\ &= \sum_{i,j} \dfrac{A_{ij}}{2 |E|} \delta_{d(i),d} \\ &= \dfrac{1}{2|E|} \sum_i \delta_{d(i),d} \sum_j A_{ij}\\ &= \dfrac{N}{2|E|} \dfrac{1}{N} \sum_i \delta_{d(i),d} d(i)\\ &= \dfrac{|V|}{2|E|} d \dfrac{1}{N} \sum_i \delta_{d(i),d}\\ &= \dfrac{d p_d}{\langle d \rangle}. \end{aligned}\]
The excess degree distribution is defined as \[q_d := \dfrac{(d+1)p_{(d+1)}}{d(G)}.\]
If \(u\) is a randomly chosen vertex and \(v\) a randomly chosen neighbour, then (assuming no correlation of degrees), \[\mathbb{P}(d(v)=d+1) = q_d.\]
Let’s carry on with the Twitch network.
>> pd=hist(d,(delta:Delta))/N;
>> qd=(delta:Delta).*/*pd/mean(d);
>> plot((delta:Delta),pd,(delta:Delta)-1,qd)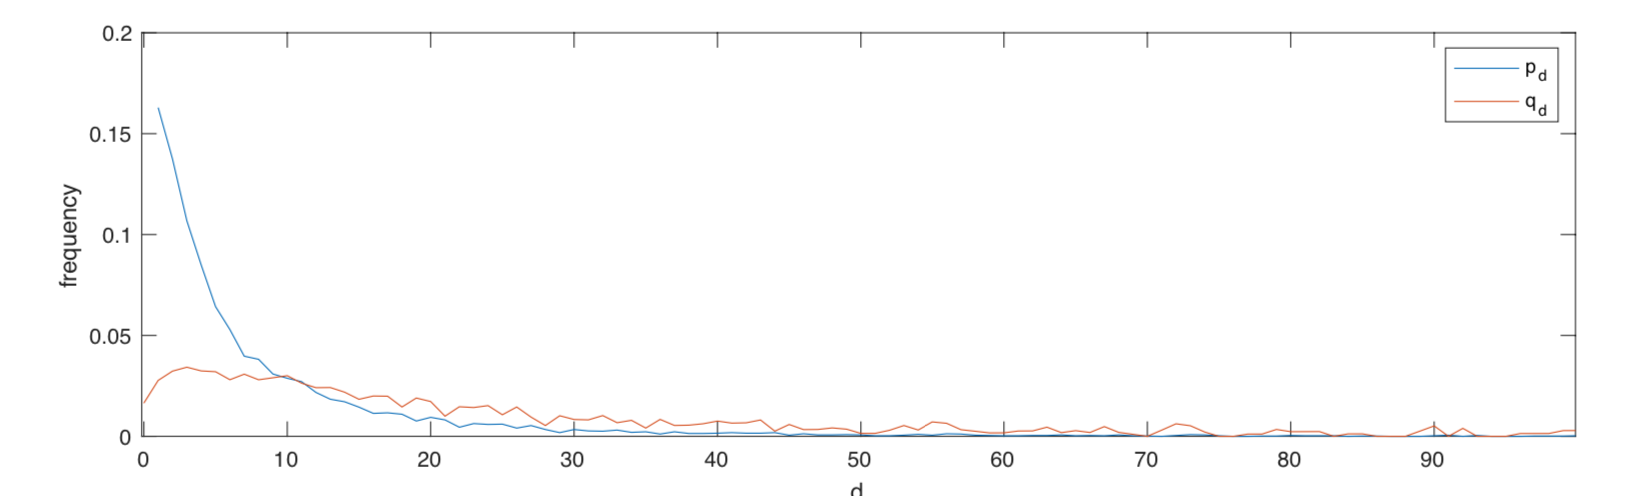
We can calculate the mean degree (9.9 in this case) either with mean(d) or pd*(delta:Delta)'. The mean of the excess degree qd*((delta:Delta)'-1) is much higher at 58.6. This fact is known as the “friendship paradox.”
Proof. \(\mathbb{E}(d(u)) = \langle d \rangle\) since \(u\) was chosen uniformly at random. Ignoring correlations in degree, we have \[\mathbb{P}(d(v)=d) = q_{d-1}.\]
So, \[\begin{aligned} \mathbb{E}(d(v)) &= \sum_d d \mathbb{P}(d(v)=d)= \sum_d d q_{d-1}\\ &= \sum_d d \left( \dfrac{d p_d}{\langle d \rangle} \right) = \dfrac{1}{\langle d \rangle} \sum_d d^2 p_d \\ &\geq \dfrac{1}{\langle d \rangle} \left( \sum_d d p_d \right)^2= \langle d \rangle \\ &= \mathbb{E}(d(u)).\end{aligned}\]
A discrete distribution \(p_d\) is said to exhibit a power law if \(\exists \alpha > 0\) s.t. \[\lim_{d \to \infty} p_d d^{\alpha} = c \in (0,\infty)\] for some constant \(c\). In this case \(\alpha\) is the exponent.
Power laws are straight lines on \(\log-\log\) graphs. They are common in real-world networks. A graph with a power law degree distribution is called scale-free if \(p_d \sim d^{-\alpha}\), then \[p_{\lambda d} \sim \lambda^{-\alpha} d^{-\alpha} \sim p_d.\]
Here is the tail of the degree distribution from the Twitch social network:
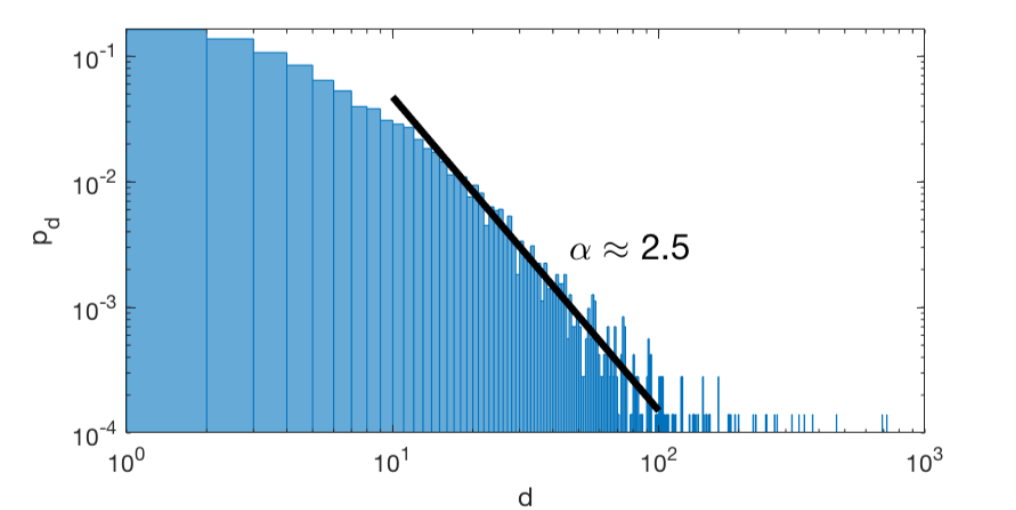
Here is a mathematical example. Suppose \[p_d = \begin{cases} \dfrac{18}{d(d-1)(d-2)(d-3)} & d \geq 4 \\ 0 & d < 4 \end{cases}\] so \(p_d d^4 \to 18\).
Proposition 4.3 If \(p_d\) is a power law distribution with exponent \(\alpha\) then:
\(\alpha > 1\);
\(\langle d \rangle = \infty\) if \(\alpha \leq 2\);
Generally, \(\langle d^m \rangle = \infty\) for \(m \geq \alpha-1\).
Proof. Exercise
A large graph is said to have the small-world property if the typical distance between a pair of vertices is \(\sim \log |V|\).
We can calculate the pairwise distances in Matlab using
>> G=graph(A);
>> D=distances(G);
In the case of the Twitch network, we find the mean pairwise distance between vertices (mean(D(:))) is 3.68. This is the same order of magnitude as the log of the number of vertices \(\log_{10}(7126)\approx 3.85\).
For a contrast, consider a more mathematically structured network - a 2D lattice of about the same size (\(84\times84=7056\)). In that case we find a mean pairwise distance of 56.
>> C=toeplitz([0,1,zeros(1,82)]);
>> B=kron(C,eye(84))+kron(eye(84),C);
>> G2=graph(B);
>> D2=distances(G2);
>> mean(D2(:))
A large graph is tree-like if the set \(\mathcal{C}_{\ell}\) of cycles of length \(\ell\) obeys \[|\mathcal{C}_{\ell}| \ll |V| \quad \text{for any $\ell$}.\]
Generally, social networks are not tree-like. This is because human relationships tend to form in groups around shared characteristics (school, interests, workplace, etc.).
For example, in the Twitch network, we find the average number of triangles per vertex is 12.3 (mean(diag(A^3))/2)
4.2 Erdős-Rényi random graphs
The Erdős-Rényi Type I random graph \(\mathcal{G}(N,M)\) has \(|V|=N\) and \(|E|=M\) with edges chosen uniformly at random.
\[\mathbb{P}(\mathcal{G}(N,M)=G) = \binom{\binom{N}{2}}{M}^{-1}\] if \(|V|=N\) and \(|E|=M\).
Think of starting with \(N\) disconnected vertices and adding \(M\) edges at random.
\(\mathcal{G}(3,2)\) chooses uniformly from

\(\mathbb{P}=\dfrac13\)
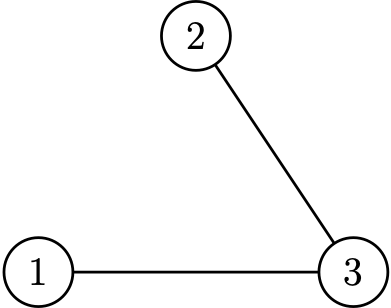
\(\mathbb{P}=\dfrac13\)
\(\mathbb{P}=\dfrac13\)
However, this is not actually a very useful example, as most of the time we will be interested in large Erdős-Rényi graphs. It turns out these have some quite specific properties…
Proposition 4.4 Consider ER-I random graphs \(G_N\) with \(M = Nc/2\), so that the mean degree is fixed at \(\langle d \rangle = c\). As \(N \to \infty\) we have
\(p_d \to \dfrac{c^d e^{-c}}{d!}\quad\) Poisson degree distribution
\(q_d \to \dfrac{c^d e^{-c}}{d!}\quad\) Poisson excess
\(C(i) \to 0\quad\) zero clustering.
Proof. Sketch! (see MA40239 for details)
i. Since all vertices are equivalent (in probability) it’s enough to check the degree of vertex \(1\). \[\begin{aligned} \mathbb{P}(d(1)=d) &= \dfrac{ \binom{N-1}{d} \binom{\binom{N}{2} - (N-1)}{M - d} }{\binom{\binom{N}{2}}{M}}\\ &\approx \binom{N-1}{d} \left(\dfrac{c}{N}\right)^d \left(1-\dfrac{c}{N}\right)^{N-d-1} \\ &= \dfrac{c^d}{d!} \underbrace{\dfrac{N-1}{N}}_{1} \underbrace{\dfrac{N-2}{N}}_{1} \ldots \underbrace{\dfrac{N-d}{N}}_{1} \underbrace{ \left(1 - \dfrac{c}{N}\right)^{N}}_{e^{-c}} \underbrace{ \left(1 - \dfrac{c}{N}\right)^{-d-1}}_{1} \\ &\stackrel{N \to \infty}{\to} \dfrac{c^d}{d!} \cdot 1 \cdot \ldots \cdot 1 \cdot e^{-c} \end{aligned}\]
So \(p_d \to \dfrac{c^de^{-c}}{d!}\).
ii. \[\begin{aligned} q_d &= \dfrac{(d+1)p_{d+1}}{d(G)}\\ &= \dfrac{(d+1) c^{d+1} e^{-c}}{c (d+1)!} \\ &= \dfrac{c^de^{-c}}{d!} . \end{aligned}\]
iii. The number of pairs of neighbours of vertex \(i\) is of the order of \[\binom{c}{2} = \dfrac{c(c-1)}{2}\]

Each pair forms a triangle only if the other edge is present whichoccurs with probability \(\dfrac{c}{N}\).
So as \(N \to \infty\), the number of triangles containing vertex \(i\) goes to zero in probability.
Proof. Sketch! First count the number of possible cycles of length \(\ell\):

\[\underbrace{\binom{N}{\ell}}_{\text{choose vertices}} \underbrace{\ell!}_{\text{order}} \underbrace{\dfrac{1}{2}}_{\text{direction}}\]
For this cycle to appear in \(\mathcal{G}(N,M)\), we need \(M-\ell\) edges in the remaining \(\binom{N}{2}-\ell\) places.
\[\begin{aligned} \mathbb{E}(\mathcal{C}_{\ell}) &= \dfrac{1}{2} \binom{N}{\ell} \ell! \binom{\binom{N}{2}-\ell}{M-\ell} \binom{\binom{N}{2}}{M}^{-1}\\ &= \dfrac{1}{2} (N(N-1)\ldots(N-\ell+1)) \dfrac{\left( M(M-1)\ldots(M-\ell+1) \right)}{\left( \binom{N}{2} \ldots \left(\binom{N}{2}-\ell+1\right) \right)}\\ &\approx \dfrac{1}{2} \left(\dfrac{2M}{N}\right)^{\ell}\\ &= \dfrac12 c^{\ell} \\ &\ll N. \end{aligned}\]
Proof. Sketch! Explore the graph starting from an arbitrary vertex. Write \(Z_n\) for the number of vertices at distance \(n\).

\[Z_0=1, \quad \mathbb{E} Z_1 = c, \quad \mathbb{E} Z_2 = ?\]
\[\mathbb{E} Z_2 = c \sum_{d=0}^{\infty} d q_d = c^2\]
In general \[\mathbb{E} Z_n \approx c^n.\]
So \[\mathbb{E}(\text{number of vertices at distance $<L$}) \approx \sum_{\ell=0}^{L-1} c^{\ell} = \dfrac{c^L - 1}{c - 1}.\]
Solving \[N = \dfrac{c^L-1}{c-1}\] how far we have to search to reach every other vertex \[L = \log_c ((c-1)N+1) \sim \log N.\]
4.3 Configuration model
The configuration model \(\mathcal{G}(N, \boldsymbol{d})\) chooses a random graph with a given degree sequence \(\boldsymbol{d}\) (or degree distribution \(p_{d}\)) uniformly at random. Generally, we assume \[\langle d \rangle = \dfrac{1}{N} \sum_i d_i \ll N.\]
Proof. Sketch. Think about edge “stubs.” Each half edge coming out of \(i\) is (almost) equally likely to attach to any other half edge in the whole graph, \(d_j\) of which belong to \(j\).
So, \[\mathbb{P}(i \sim j) \approx d_i \dfrac{d_j}{2|E| - d_i} \approx \dfrac{d_i d_j}{N \langle d \rangle}.\]
Proof. Tree-like: too long. Clustering (sketch). Recall \[C_i = \dfrac{\text{number of triangles containing $i$}}{\text{number of pairs of neighbours of $i$}}\] and \[C(G) = \dfrac{1}{N} \sum_i C_i.\]
Choose a vertex \(i\) at random and let \(j\) and \(k\) be a pair of neighbours. Each has one edge to \(i\) that we know about, so following 4.7 \[\mathbb{P}(j \sim k) \approx \dfrac{(d_j-1)(d_k-1)}{\langle d \rangle N}.\]
Now \(j\) and \(k\) are neighbours of a random vertex, so \((d_j-1)\) and \((d_k-1)\) follow the excess degree distribution.
We compute \[\begin{aligned} \mathbb{E} [C(G)] &\approx \sum_{d_j, d_k \geq 1} q_{d_{j}-1} q_{d_{k}-1} \dfrac{(d_j-1)(d_k-1)}{\langle d \rangle N}\\ &= \dfrac{1}{\langle d \rangle N} \left(\sum_d q_{d-1}(d-1) \right)^2\\ &= \dfrac{1}{N \langle d \rangle^3} \left(\sum_d d(d-1)p_d \right)^2\\ &= \dfrac{(\langle d^2 \rangle - \langle d \rangle)^2}{N \langle d \rangle^3}.\end{aligned}\]
Proof. Sketch. Explore the graph starting from a random vertex.
\[Z_n = \text{number of vertices at distance $n$}\]
\[\begin{aligned} && Z_0 = 1 \\ && \mathbb{E} Z_1 = \langle d \rangle \\ && \mathbb{E} Z_2 = \langle d \rangle \sum_d d q_d \\ && \vdots \\ && \mathbb{E} Z_n = \langle d \rangle \left( \sum_d d q_d \right)^{n-1} \end{aligned}\]
\(\mathbb{E} Z_n\) grows exponentially if \[\sum_d d q_d > 1.\]
But \[\sum_d d q_d = \dfrac{\langle d^2 \rangle}{\langle d \rangle} - 1,\] so we require \(\langle d^2 \rangle > 2 \langle d \rangle\).
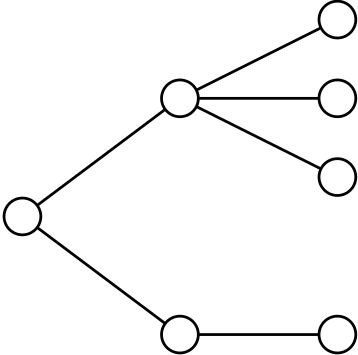
If \(\Delta=3\) then config model graphs locally look like binary search trees.
>> A=configmodel(randi(3,1,1000));
>> G=graph(A);
>> plot(G,'Layout','layered')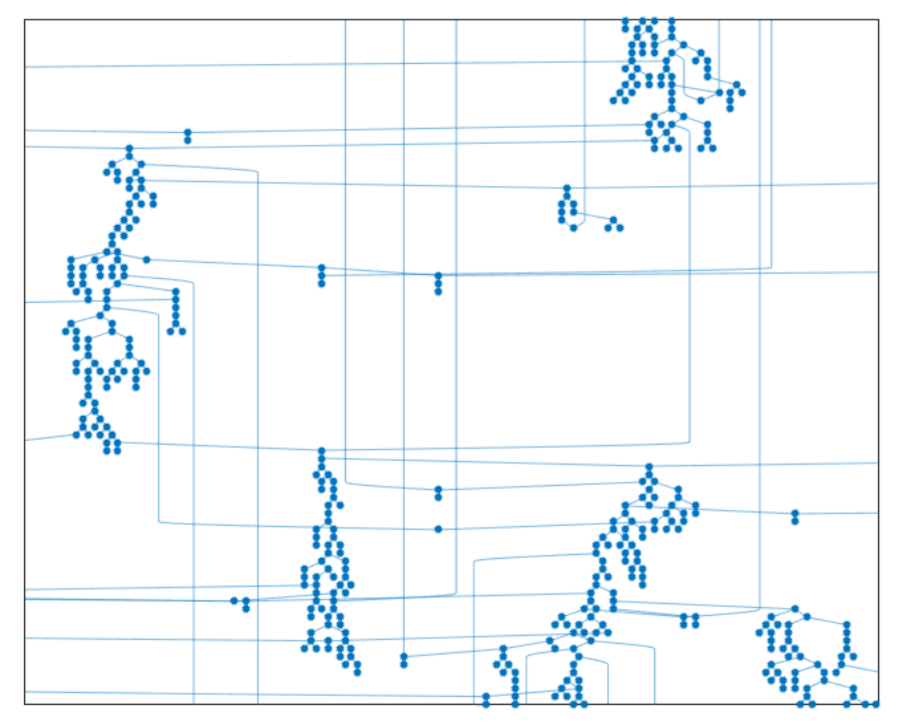
4.4 Contagion in model networks
Proposition 4.10 (Newman) Let \(G\) be a configuration model random graph with degree distribution \(p_d\) and define the generating functions \[\begin{aligned} && g(x) = \sum_d x^d p_d\\ && h(x) = \sum_d x^d q_d \end{aligned}\]
Then the expected risk \(\langle r \rangle\) of a random vertex is \[\langle r \rangle = 1 - g(1-t),\] where \(t\) is the largest solution in \([0,1]\) of \[t = T(1 - h(1-t)).\]
In particular, the expected contagion threshold is \[\langle T_c \rangle = \dfrac{1}{h'(1)} = \left( \sum_d d q_d \right)^{-1}\,.\]
Proof. Sketch. From the definition we compute \[\begin{aligned} \langle r \rangle &= \mathbb{E} r_i \\ &= \mathbb{E} \left( 1 - \prod_{j \sim i}(1-t_{ji}) \right) \\ &\approx 1 - \sum_d p_d \mathbb{E} \prod_{\ell=1}^d (1-t_{\ell})\\ &\approx 1 - \sum_d p_d (1-\mathbb{E} t_{\ell})^d\\ &= 1 - g(1-t), \end{aligned}\] where \(t=\mathbb{E} t_{\ell}\).
Moreover, \[\begin{aligned} t &= \mathbb{E} t_{\ell} \\ &= \mathbb{E} \left[ T \left( 1 - \prod_{\ell' \stackrel{H}{\to} \ell}^d (1-t_{\ell'}) \right) \right]\\ &\approx T \left(1 - \sum_{d} q_d (1-t_{\ell'})^d \right)\\ &= T (1-h(1-t)). \end{aligned}\]
Note \(t=0\) is always a solution, since \(h(1)=1\). We check for stability: \[\dfrac{\partial}{\partial t} T (1 - h(1-t)) \Big|_{t=0} = T h'(1),\] so \(t=0\) is unstable (and a \(t>0\) solution exists) if \[T > T_c = \dfrac{1}{h'(1)}.\]
Let \(G\) be a large random graph in which every vertex has degree \(3\).
Then \[\begin{aligned} && p_d = \delta_{d,3}, \quad q_d = \delta_{d,2}\\ && g(x)=x^3, \quad h(x)=x^2 \end{aligned}\]
\[\begin{aligned} && t=T(1-h(1-t))\\ &\Leftrightarrow& t = T(1-(1-t)^2) = T t(2-t)\\ &\Rightarrow& t = 0 \quad \text{or} \quad t = 2 - \dfrac{1}{T} \end{aligned}\]
Largest solution in \([0,1]\), so \[t = \begin{cases} 0 & T<1/2 \\ 2-\dfrac{1}{T} & T \geq 1/2 \end{cases}\] and \[\langle r \rangle = \begin{cases} 0 & T<\dfrac{1}{2} \\ 1- \left(\dfrac{1}{T}-1\right)^3 & T \geq \dfrac{1}{2} \end{cases}\]
Let’s see this result in action…
>> A=configmodel(3*ones(1,1000));
>> P=EpiSim(A,T,100);
>> plot(T,max(0,(1-(1./T-1).^3)),T,mean(P'),'ok')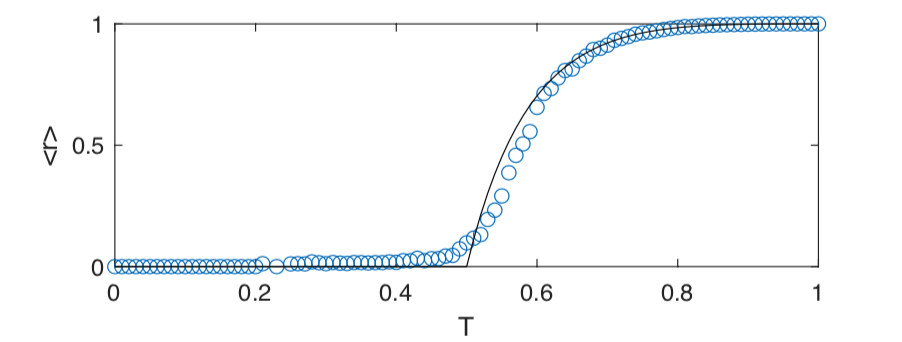
NB! Not all examples have \(T=1\), \(\langle r \rangle = 1\).
4.5 Prefferential attachment
How might real social networks be formed? The bible (Matthew 25:29) says “unto everyone that hath shall be given,” or in modern parlance “the rich get richer.”
The Barabasi-Albert is a model of a network growing via preferential attachment. Starting from a complete graph on \(m\) vertices, new vertices are added one at a time, each attaching to \(m\) neighbours chosen with probability proportional to vertex degree.
Proposition 4.11 As \(N \to \infty\) the degree distribution of the BA model converges to \[p_d = \dfrac{2m(m+1)}{d(d+1)(d+2)} \quad \text{for $d \geq m$}.\]
In particular, the mean degree is \(2m\) but the mean excess degree is \(\infty\).Proof. Sketch. How does the degree distribution change with the addition of one new vertex? On average, new number of degree \(d\) vertices \[\begin{aligned} (N+1)p_d^{(N+1)} &= N p_d^{(N)} \quad \text{old number}\\ & + \delta_{d,m} \quad \text{one more of degree $m$}\\ & + m \dfrac{d-1}{\sum_k k p_k^{(N)}} p_{d-1}^{(N)} \quad \text{connect to degree $d-1$}\\ & - m \dfrac{d}{\sum_k k p_k^{(N)}} p_{d}^{(N)} \quad \text{connect to degree $d$} \end{aligned}\]
Now, \[\begin{aligned} \sum_k k p_k^{(N)} &= \dfrac{2 |E|}{N} \\ &= \dfrac{2}{N} \left( \dfrac{m(m-1)}{2} + (N-m)m\right)\\ &\to 2m. \end{aligned}\]
If \[p_d^{(N)} \to p_d \quad \text{as $N \to \infty$},\] we find \[p_d = \delta_{d,m} + \dfrac{d-1}{2} p_{d-1} - \dfrac{d}{2} p_d.\]
This is a difference equation that we will solve using the method of generating functions:
Multiply by \(x^d\) and sum.
Rewrite everything in terms of \(g(x)\).
Solve for \(g(x)\).
Series expand \(g(x)\) to find \(p_d\).
\[\begin{aligned} g(x) &= \sum_d x^d p_d \\ &= \sum_d x^d \left[ \delta_{d,m} + \dfrac{d-1}{2} p_{d-1} - \dfrac{d}{2} p_d \right]\end{aligned}\]
\[\begin{aligned} \sum_d x^d \delta_{d,m} &= x^m \\ \sum_d (d-1) p_{d-1}x^d &= x^2 \sum_{d} x^{d-2} (d-1) p_{d-1} \\ &= x^2 \dfrac{d}{dx} \sum_{d} x^{d-1} p_{d-1} \\ &= x^2 g'(x)\\ \sum_d d p_{d}x^d &= x \sum_{d} x^{d-1} d p_{d} \\ &= x \dfrac{d}{dx} \sum_{d} x^{d} p_{d} \\ &= x g'(x)\end{aligned}\]
Differential equation for \(g\) \[\begin{aligned} && g(x) = x^m + \dfrac{x^2}{2} g'(x) - \dfrac{x}{2} g'(x)\\ && g'(x) + \dfrac{2}{x(1-x)} g(x) = \dfrac{2x^{m-1}}{1-x}\end{aligned}\]
Solve using an integrating factor…
\[\begin{aligned} \dfrac{d}{dx} \left[\left(\dfrac{x}{1-x}\right)^2 g(x)\right] &= \left(\dfrac{x}{1-x}\right)^2 \left[g'(x) + \dfrac{2}{x(1-x)} g(x)\right]\\ &= \left(\dfrac{x}{1-x}\right)^2 \dfrac{2x^{m-1}}{1-x}\\ &= \dfrac{2x^{m+1}}{(1-x)^3}\\ &= 2x^m \sum_{n=1}^{\infty} \dfrac{n(n+1)}{2} x^n\end{aligned}\]
\[\begin{aligned} &\Rightarrow& \left(\dfrac{x}{1-x}\right)^2 g(x) = \sum_{n=1}^{\infty} \dfrac{n(n+1)}{n+m+1} x^{n+m+1}\\ && g(x) = \left(\dfrac{1}{x^2} - \dfrac{2}{x} + 1 \right) \sum_{n=1}^{\infty} \dfrac{n(n+1)}{n+m+1} x^{n+m+1}\end{aligned}\]
\(p_d\) is the coefficient of \(x^d\) in \(g(x)\), it has three terms – when \(d=n+m+1\), \(d=n+m\) and \(d=n+m-1\).
\[\begin{aligned} p_d &= \dfrac{(d-m-1)(d-m)}{d} - 2 \dfrac{(d-m)(d-m+1)}{d+1} + \dfrac{(d-m+1)(d-m+2)}{d+2} \\ &= \ldots \\ &= \dfrac{2m(m+1)}{d(d+1)(d+2)}.\end{aligned}\]
Finally, we already calculated \[\langle d \rangle = \sum_d p_d d = 2m,\] thus \[q_d = \dfrac{m+1}{(d+2)(d+3)},\] so \[\sum_d d q_d = \infty.\]