Music links
Music Tutorial - Displaying a pmap
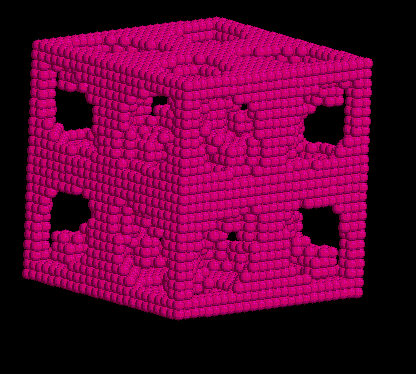
Once your map has been created, a xyz file can be created to display the points where a value for the potential was stored (In the map control file , you specified a high end potential cut off. No values are stored if the potential at any point is larger than this value, i.e. when the point overlaps with a framework atom). Displaying the map, helps you to see if you map looks ok or completely wrong.
Compile music_mapdisplay.F90 as described here.
You will also need a control file for the program which can be found in the music/ctrlfiles directory.
# generates a display of a pmap
# reads the pmap and generates a rasmol-plottable xyz file
#
---------- Simulation Cell Information ----------------
IRMOF1.mol                     # Sorbate molecule file
1,1,1                          # Number of unit cells in x,y,z
1,1,1                          # Leaving this as 1,1,1 gives periodic boudary conditions which will copy the unit cell in the x,y,z directions
-------------------------------------------------------
--- bmap to XYZ info ---
25,25,25                      # number of points to be displayed in each direction.
ARITHMETIC
0, 100
mapIRMPOF1.xyz                   # name of the xyz file that this will produce
1st map                                    # 2nd line for xyz file, just a description
Ne                                           # Name of atom in xyz file. Put He, Ne, ...  here
IRMOF1.Methane.LJ.map       # name of pmap which should be in the folder that the environment file states
300  		    	# biasing temperature leave at 300
It should look like a cube of pink dots with the shape of your structure cut out of the inside when viewed in RasMol with spacefill.