Diode IV Characteristics
Introduction
The trend that data follows as a parameter is varied is often quite complex. In such as case it can be difficult to see how well a set of measurements or predictions is following a trend. Linearisation is used to cast a complex relationship into a linear (straight line) form where it is far easier to see if of data is following an expected trend. Graphing and linear regression can be used to gain a mathematical or statistical measure of how well a trend is being followed.
Diodes are commonly used in many circuits, and the commonly used transistor often contains two diode junctions. The relationship between the diode current and the voltage across the diode is called the Diode Law and is not a simple linear relationship. The non-linear relationship is however fairly simple to linearise. The purpose of this laboratory exercise is to measure the current-voltage (I-V) characteristic of a diode. Examining the I-V characteristic data with a simple linearisation allows for simple measurement of two of the main parameters in the Diode Law and illustrates how well the Diode Law models the relationship between current and voltage in a diode. The experiment also complements the material in the Circuit Theory parts of the course on diodes.
Objectives
-
To measure the I-V characteristic of a 1N4148 silicon diode.
-
Assess the leakage current and ideality factor of the diode.
-
Assess the influence of measurement accuracy in characterising the diode.
Preparation
-
Read this script to find out what is needed to do in the Laboratory session.
-
Develop a simple spreadsheet in which to record measurements to be taken in the Procedure section.
-
Find out how to produce a plot with logarithmic scales rather than linear scales.
Theory
In its most simple form the diode is an electronic switch that allows current to pass in one direction, but stops it flowing in the opposite direction. When current is allowed to flow the device is said to be forward-biased, while under reverse bias it prevents or blocks current flow. This current versus voltage behaviour is used to characterise a diode.
Theoretically, the current-voltage characteristic for an ideal diode can be described mathematically by the Diode Law as:
\[I_d ~=~ I_s\, \left[ \exp{\left( \frac{q\,V_f}{\eta\,k\,T} \right)} ~-~ 1 \right]\]where:
-
$I_d$ is the forward bias current through the diode;
-
$I_s$ is the reverse bias leakage current, often called the saturation current;
-
$\eta$ is the ideality factor;
-
$q$ is the charge on an electron ($q = 1.602\times 10^{-19}\, C$);
-
$V_f$ is the applied forward voltage;
-
$k$ is Boltzmann’s constant ($k = 1.38\times 10^{-23}\,J/K$) and
-
$T$ is the absolute temperature in degrees Kelvin.
This equation is theoretically valid for both forward ($V_f>0$) and reverse ($V_f<0$) bias. The ideality factor depends on the current flow mechanisms at the diode junction. If current flow is dominated by simple drift and diffusion mechanisms then $\eta=1$. If electron-hole recombination dominates the current flow then $\eta=2$. For most diodes $\eta$ is in the range $1 \leq \eta \leq 2$. For a given forward bias the higher values of $\eta$ will result in a lower forward current.
The Diode Law has an implicit exponential form which is non-linear. This is easily linearised by taking the logarithm of the equation:
\[\begin{array}{cccccc} I_d + I_s &=& I_s & \times & \exp{\left( \frac{q\,V_f}{\eta\,k\,T} \right)} & \\ \log{\left( I_d + I_s \right)} &=& \log\left(I_s\right) & +& \left( \frac{q\,V_f}{\eta\,k\,T} \right) & \\ \log{\left( I_d + I_s \right)} &=& \log\left(I_s\right) & +& \frac{q}{\eta\,k\,T} & V_f\\ y &=& C & +& M & x \end{array}\]In the case where $I_d \gg I_s$ plotting $\log(I_d)$ against the diode voltage will produce a straight line where the ideality factor $\eta$ and the saturation current $I_s$ can be determined from the gradient and the intercept of the graph.
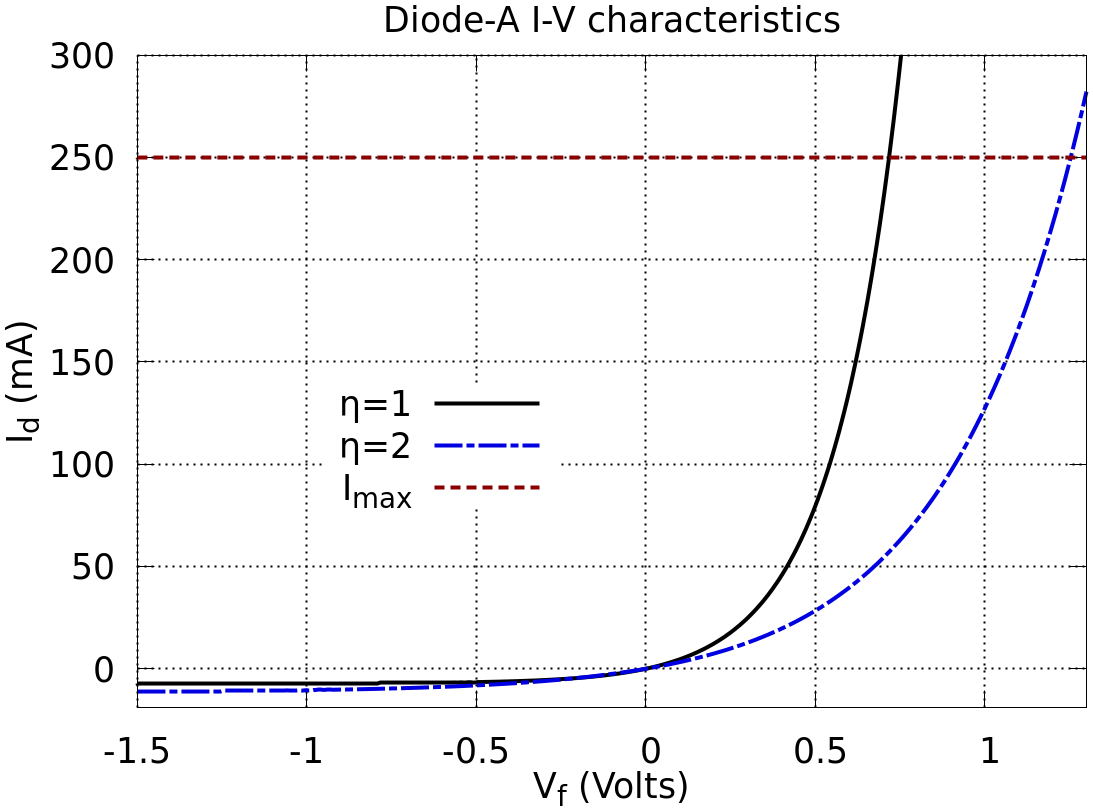
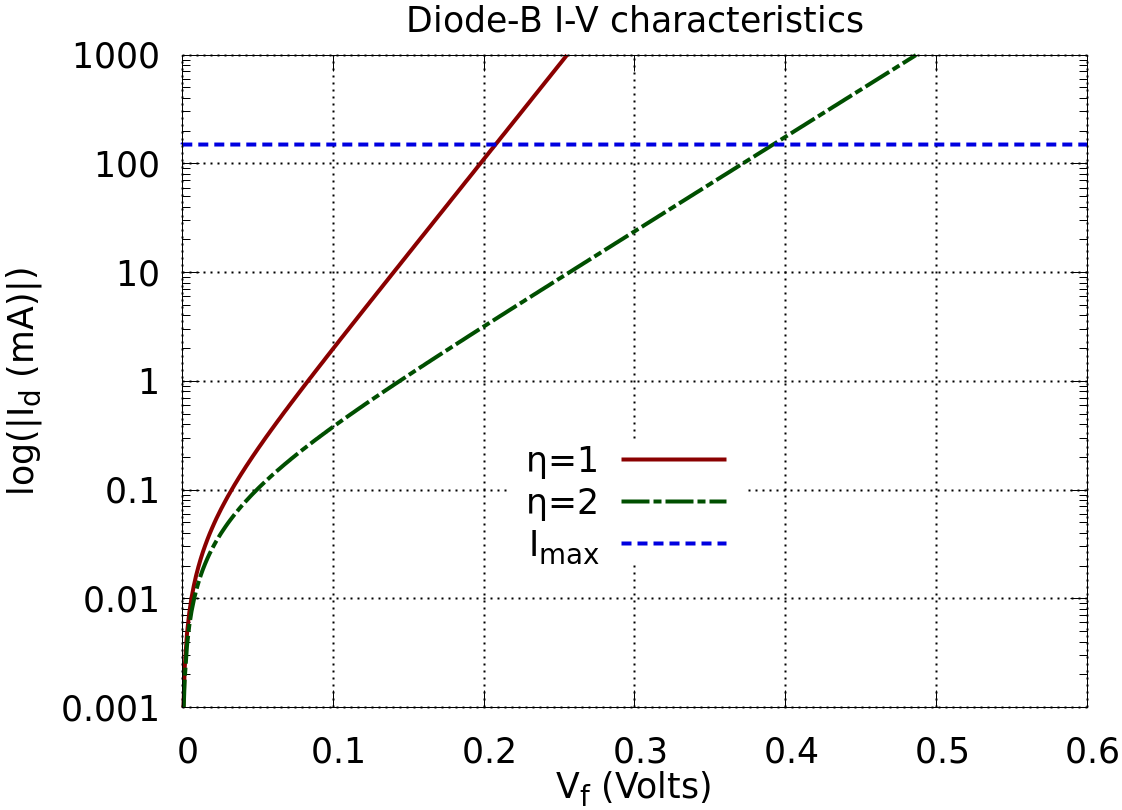
Example I-V characteristics are shown in and for two different diodes. In the diode has a very high saturation current in order that the saturation current can be seen on a linear current scale. In the saturation current is more realistic and a logarithmic scale is used for the current. This shows the expected linear trend when $I_d \gg I_s$. Note that the logarithm of the magnitude of the current is taken so that the negative reverse bias current $I_s$ can be observed.
It is also important to recognise that a diode, and most other semiconductor devices, will have a maximum specified current $I_{max}$ that it can conduct before the diode is potentially damaged.
Test Circuit
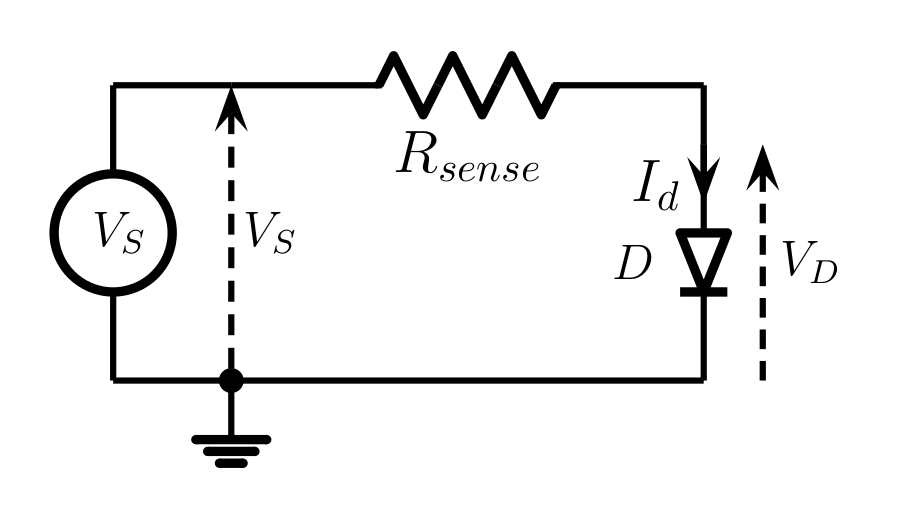
The test circuit is shown in . Measuring $V_S$ and $V_D \approx V_f$ allows for simple determination of the current flow through the diode $I_d = (V_S-V_D)/R_{sense}$. This naturally gives simultaneous measurements of the diode current $I_d$ and the voltage applied to the diode $V_D$.
The use of different sensing resistances $R_{sense}$ allows measurement of a very wide range of currents. The suggested values to use for the sensing resistances are $10\,\Omega$, $100\,\Omega$, $1\,k\,\Omega$, $10\,k\,\Omega$, $100\,k\,\Omega$ and $1\,M\,\Omega$.
Caution is needed with this circuit in order to prevent damaging the diode. Diodes have a maximum current they can conduct, and in the case of the 1N4148 used in this experiment the maximum current is 150 mA. When using a power supply with a maximum voltage of 6 V to set $V_S$ the maximum possible current through the sensing resistor is $I_{Rmax} = V_S/R_{sense}$ when $V_D=0$. For the $100\,\Omega$ resistor this is 60 mA and for the greater values of sensing resistor $I_{Rmax}$ is smaller. Hence the diode should not be damaged in these cases. However caution is needed when using the $10\,\Omega$ resistor as $I_{Rmax}$ is 600 mA which clearly exceeds the limit for the 1N4148 diode. In this case at the greatest current of 150 mA the voltage drop across $R_{sense}=10\,\Omega$ is 1.5 V. If the diode voltage is say $V_D=0.5~V$ then $V_S$ needs to be 2 V at most. However it is only during the measurements that the true diode voltage $V_D$ becomes apparent.
Procedure
Initial settings and observations
-
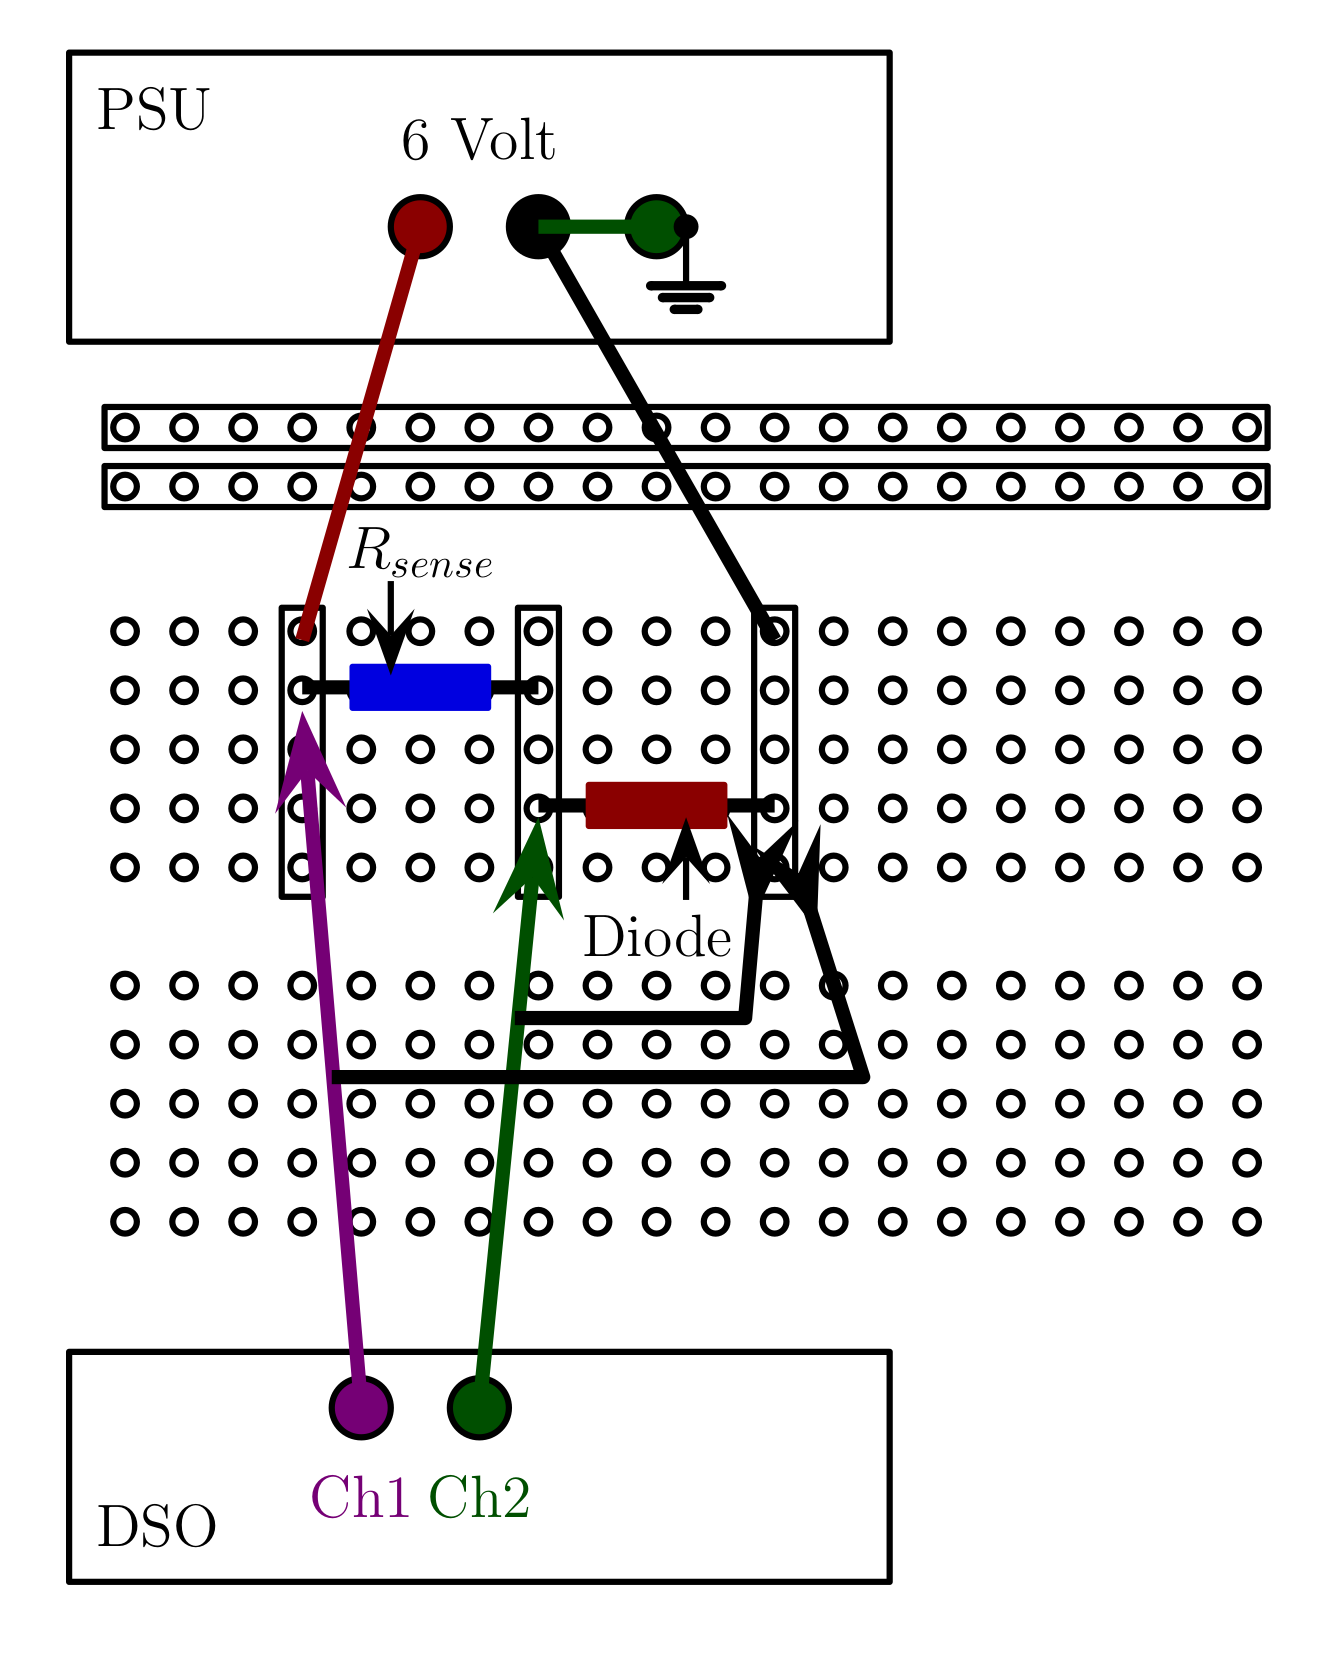
Connect the sensing resistor and the 1N4148 diode to the BreadBoard as shown in . The 6 V terminals of the PSU should be used. The crocodile clip of the oscilloscope probes attached to the Digital Oscilloscope should be connected to common connection of the diode and the negative PSU supply as shown, while the probes connect to measure $V_S$ and $V_D$.
On the BreadBoards there are two rows of connected socket holes running horizontally across the top of the board. Below this there and many columns of connected sockets running vertically.
The 6 V terminals of the PSU should be used with the negative supply connected to the common Ground. The crocodile clip of the oscilloscope probes attached to the Digital Oscilloscope should be connected to common connection of the diode and the negative PSU supply as shown, while the probes connect to measure $V_S$ and $V_D$.
-
Make sure that both channels 1 and 2 are active on the Digital Oscilloscope so that two waveforms are visible. Selecting Autoscale on the Digital Oscilloscope should show both traces (although they may overlap).
-
To make recording data rather easier some of the facilities of the Digital Oscilloscope should be used. Add measures under the Measure menu for the DC-RMS values of both channels 1 and 2. Using the Acquire menu set Acquire Mode to Averaging and using the adjuster knob set the averaging factor to 32. Set the oscilloscope probes to $\times 1$ and using the Probe menu under the channel buttons ‘1’ and ‘2’ buttons set the probe scale to 1.00:1.
-
Set the output voltage on the 6 V PSU to about 1 V. Note the DC averages for both channels and determine the diode current. This should be a few milliamps.
-
Measure the diode current and voltage as the source voltage $V_S$ is set to 0.2 V, 0.4 V, 0.8 V, 1.6 V, 3.2 V and 6 V when using $R_{sense}=100\,\Omega, 1k\,\Omega, 10\,k\,\Omega, 100\,k\,\Omega$ and $1\,M\,\Omega$ noting the uncertainties in $V_S$ and $V_D$ and the resulting uncertainty in $I_d$. Take extra measures at intermediate voltages if needed.
-
Using $R_{sense}=10\,\Omega$ measure the diode current and voltage as the source voltage $V_S$ is set to 0.2 V, 0.4 V, 0.8 V, 1.6 V noting the uncertainties in $V_S$ and $V_D$ and the resulting uncertainty in $I_d$. Take extra measures at other voltages if needed but take care to keep the diode current below the 1N4148 diode’s maximum current of 150 mA.
-
Plot the data obtained as the logarithm of the diode current against the diode voltage and determine the ideality factor $\eta$ and the saturation current $I_s$ of the diode measured. Include your estimates of how accurately these values have been determined.
Data and observations submission for the Experiment
In addition to making a record of your procedure and results for this experiment in your logbooks please make sure your logbook records include:
-
Data table recorded in Initial Settings and Observations.
-
Plot of the current-voltage relationship and associated uncertainties recorded in Initial Settings and Observations.
-
Comments or observations made on the measured current-voltage data.
-
The ideality factor and the saturation current determined from the measurements, and observations made concerning accuracy of these values.