Transient and Steady-State AC-Circuit Simulation
Introduction
This CAD (computer aided design) laboratory session is intended to familiarise you with performing transient and steady-state AC-circuit analysis using the CAPTURE and PSPICE components of OrCAD.
In transient analysis, the time-domain current and voltage waveforms of circuits connected to AC sources are computed, whereas in AC steady-state analysis simulations only the magnitude and phase values of the currents and voltages in circuits (i.e., frequency-domain data) are computed for operation at specified source frequencies.
To examine how the magnitude and phase of currents and voltages varies in circuits involving R, L and C components over a range of frequencies, it is also possible to perform AC sweep analysis in which the magnitude and phase of salient currents and voltages may be plotted against frequency.
Transient analysis of AC circuit
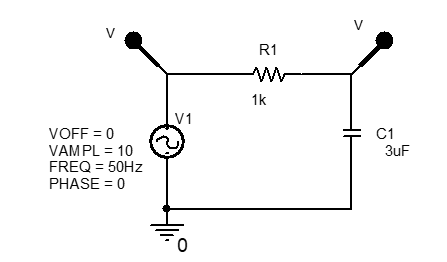
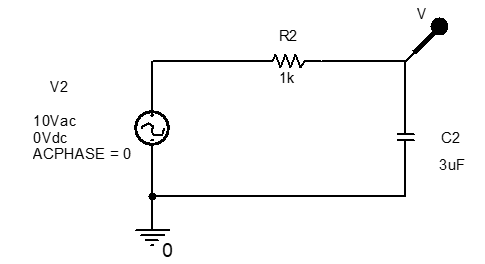
Enter the circuit shown in into OrCAD/Capture. Remember to edit component designators and values so that your circuit is the same as .
- Voltage source from SOURCE library as VSIN.
- Resistor and capacitor from ANALOG library as R and C.
- Earth symbol, using green-earth right-side-of-screen button, and select SOURCE, then select 0.
- To set the phase of the AC source, double click on the source to open the properties spreadsheet and enter 0 in the PHASE cell. Use the Display button to show the phase on the schematic.
Add voltage and current markers to monitor the AC supply voltage and capacitor voltage as shown in .
Prepare to run PSPICE to simulate circuit operation by setting up a simulation profile, i.e., from the menu bar select PSpice/New Simulation Profile, set the Name to AC-trans, and click Create.
Within the Simulation Settings dialogue box select the Analysis frame and set the Run to time to $4T$ (i.e., four periods of the 50 Hz supply voltage) and the Maximum step size to 0.1ms.
From the menu bar select PSpice/Run or click on the blue arrow on the second from top toolbar, which also starts PSPICE running.
The waveforms in should be obtained in the plot window.
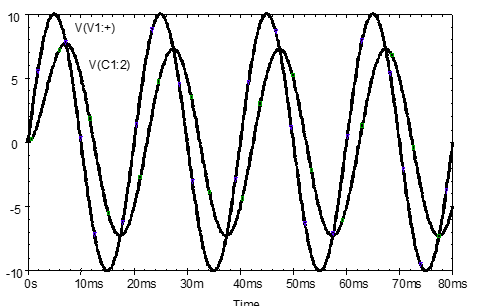
Note that the first cycle of capacitor voltage is not a true sinewave; it takes a short time for the initial connection transient to die away and for steady state AC waveforms to be output. Any measurements on the waveform to determine steady-state amplitude and phase values should therefore be made after the first cycle, e.g., at the $4^\text{th}$ cycle.
Phase angle measurement
Exercise 1
Use the plot window cursors to measure the (0-to-peak) amplitude of the capacitor voltage and its phase angle relative to the AC source voltage. Record.
\[V_{c1} = \qquad V\]The phase angle, $\phi_{vc}$ in degrees may be calculated using the time interval, $ \Delta T $, and the equation below. $ \Delta T $ is measured between any matching pair of zero crossings of the VS and $V_{c1}$ waveforms, and T is the period of the sinewave: 20 ms in the case of . The phase angle is negative in this case because $V_{c1}$ lags VS.
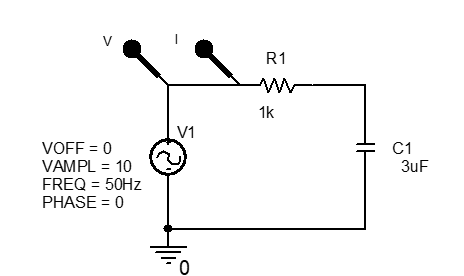
\[\phi _{vc} = - \left ( \frac{\Delta T }{T} \right )\times 360 ^{\circ} = \qquad ^{\circ}\]Remove the voltage marker on $V_{c1}$ and add a current marker as shown in to plot the circuit AC current waveform.
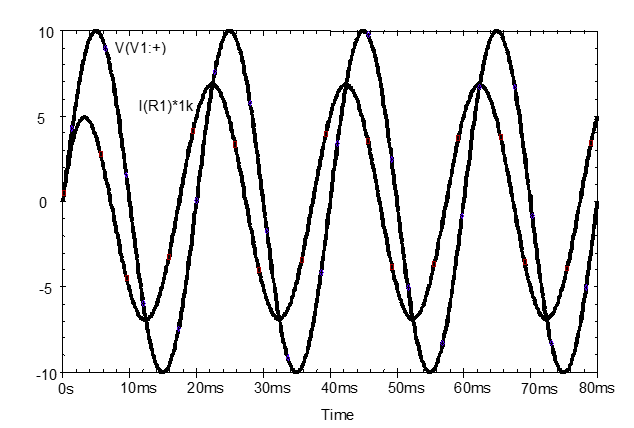
Simulate the modified circuit. Waveforms identical to those shown in should be obtained, once the current has been multiplied by 1000 so that the current waveform can be seen. To do this, double click on the $I (R1)$ legend in the plot window and change $I (R1)$ to $I (R1) \times 1e3$.
Note that the initial connection transient is more apparent in the current waveform. It takes some time for initial transient to decay and a steady-state operating condition to be obtained. It is clearer here that measure-ments should be on the last cycle for the best approximation to steady-state conditions.
Exercise 2
Use the plot window cursors to measure the (0-to-peak) amplitude of the capacitor current and its phase angle relative to the AC source voltage.
\[I_{1} = \qquad A\]The phase angle, $\phi_I$,, in degrees may be calculated using the time interval, $\Delta T$ and the equation below. $\Delta T$ is measured between any matching pair of zero crossings of the $V_S$ and $I$ waveforms, and T is the period of the sinewave: 20 ms in the case of . The phase angle is positive in this case because $I_I$ leads $V_S$.
\[\phi_I = \left ( \frac{\Delta T} {T} \right ) \times 360 ^{\circ} = \qquad ^{\circ}\]Exercise 3
State how you expect the magnitude of the capacitor current and voltage in to change as the frequency of the AC source is increased. Give an explanation for your answer in using impedance values.
It may be helpful to consider whether a capacitor approximates to an open-circuit or short-circuit as the operating frequency tends to 0 Hz, and whether a capacitor approximates to an open circuit or short circuit when the operating frequency tends to $\infty$ Hz.
AC Sweep Analysis
How voltage and current magnitude and phase change with frequency for a circuit is viewed from a frequency response graph. This comprises a graph of voltage (or current) magnitude and phase against frequency. A logarithmic scale is normally used for the horizontal frequency axis because very wide frequency ranges are often covered.
To produce a frequency response graph, change the source in to the VAC type from the SOURCE library. Set the source values as shown in ,
Edit the Simulation Profile for the circuit and change the Sweep Parameters to the following values:
Within the Simulation Settings dialogue box, set:
- Analysis Type: to AC Sweep/Noise
- Start Frequency: to 1Hz
- End Frequency: to 100kHz
- Points/Decade: to 100
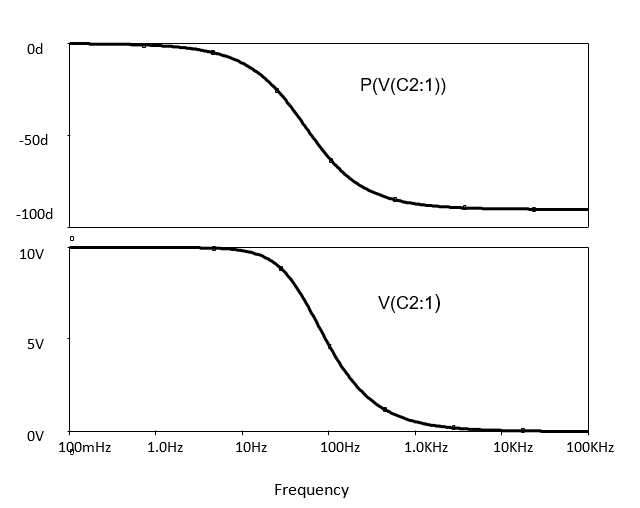
Close the Simulation Settings dialogue box. Add a voltage marker to the capacitor as shown in so that that the capacitor voltage magnitude and phase can be plotted.
Run the simulation and view the output in the plot window.
Clearly the capacitor approximates better and better to an AC short circuit as the frequency increases because the capacitor voltage magnitude reduces to a very low value as the source frequency increases.
Before adding the phase response to the graph note that $V_C$ spans a smaller range, i.e., 0V to 10V. Since the phase variation will span a much greater range and goes negative (i.e., see .6, 0$^{\circ}$ to -90$^{\circ}$) it is better to plot the phase on a separate plot with separate Y axis scaling.
From the Plot menu, select Plot/Add Plot to Window.
To add the phase response, select Add from the Trace menu. On the right side of the Add Traces window scroll down within the Function or Macros section to $P( )$. Click on this and on $V(C2:1)$ to insert between the brackets, and then click on OK.
The variation in the phase angle of $V_{C2}$ relative to $V_S$ is then added to the plot as illustrated in .
Exercise 4
Use the plot window cursors to measure the capacitor voltage magnitude and phase when the source frequency is as close to 50Hz and 100 kHz as you can get. Record the exact frequency and the capacitor voltage magnitude and phase at each frequency.
\[V (50 Hz) = \qquad \angle \qquad ^{\circ} V\] \[V (100 Hz) = \qquad \angle \qquad ^{\circ} V\]Exercise 5
Replace the voltage probe in with a current probe and produce and sketch a magnitude and phase plot of the circuit current, for a 1Hz to 10kHz frequency range, similar to .
Explain in terms of component why circuit current increases with AC source frequency and why is its value limited at high frequency.
Exercise 6
Perform an AC Sweep simulation of a circuit comprising a 10V AC source connected in series with a 10$\Omega$ resistor and 20mH inductor. Do this over a frequency range of 1 Hz to 10 kHz.
Perform simulations to show with sketches, first, how the inductor current magnitude and phase and then, how voltage magnitude and phase vary with frequency.
\[\text{Current} \qquad \qquad \qquad \qquad\text{Phase}\] \[\text{Voltage} \qquad \qquad \qquad \qquad\text{Phase}\]Write an explanation to justify why the inductor voltage and current phases vary with frequency in the way shown in these frequency-response graphs.
Reflection on skills and learning
Complete outside the lab if you run out of time in your lab notebook. Comment on your individual attainment as suggested below.
What percentage of the lab work did you complete? How do you rate your participation as a lab group member?
What level of proficiency do you feel you achieved in transient and AC sweep simulation and analysis. Choose one of the following and add a comment.
- High –confident in setting up and running the simulations, have good understanding of results and can correctly predict magnitude and phase variation with frequency. In future, can apply in —-?
- Medium – some further practice required but have reasonable understanding of setting up and running simulations and understand the form of magnitude and phase variation in most circuits. More practise is especially required in —–?
- Basic – can follow the process and results but need greater individual practice to master circuit input and interpretation. The main obstacles to more confident circuit-simulation set up and understanding of the magnitude and phase variation are —–?
List two or more ways in which attending and completing the lab work has been of value.
List any suggested changes to the lab work that you identified which would facilitate circuit theory learning and acquiring AC circuit simulation and analysis skills.