The binary search tree, aka Quicksort
Skip to:
Non-mathematical description
Basic mathematical description
My research
Going further
Return to main research page
Non-mathematical description
These descriptions are usually not entirely accurate, and sometimes not at all accurate. They're just stories, not mathematical descriptions.
You're given a pile of exam scripts to mark. They're in alphabetical order according to the surname of the student who took the exam. You mark the scripts, and then you need to sort them into mark order, with the highest mark at the top and the lowest at the bottom. If there are 20 scripts, that might not take you too long. But what if there are 200 scripts? Or 2000?
Now imagine you're the UK government, and you've been sent 20 million census forms. You need to sort them too... or maybe you're a computer and you have 20Gb of data (that's around 2*10^10 bytes) to keep in some kind of reasonable order that you can easily access.
You get the idea. It quickly becomes very important to have efficient ways of sorting data, and to know how long it will take you to sort that data. One very good sorting algorithm is the aptly-named Quicksort. There's a nice picture of quicksort in action from Wikipedia, made by RolandH, below.

Basic mathematical description
These descriptions may contain some small inaccuracies in order to keep the discussion at a basic level.
Here is the quicksort algorithm for sorting a list of data (let's say numerical data) into order. Take your first datum and put it at the root of a binary tree. Now for every new piece of data, start at the root. If it is smaller than the current vertex go left; if it is bigger then go right. Repeat until you reach an empty vertex, and put your new piece of data there. Once all your data are in the tree you can simply read them off from left to right.
This takes, on average, something like n*log(n) comparisons to sort n items. That's good.
Actually I kind of lied. When I said "take your first datum", if your data are close to ordered already then quicksort performs badly - you just end up with one long branch in your tree, which means lots of comparisons. So it's best to shuffle all your data before you start! (Sometimes I call this random quicksort, but in most applications no-one sensible would use non-random quicksort so the "random" moniker is a bit redundant.) Mathematically we can just assume that your data are uniformly distributed on [0,1]. Mathematicians sometimes call this the binary search tree instead of quicksort - I'm not sure why.
Anyway, as we saw briefly above, the main stumbling block that we come across is having long branches of our tree. So the first question we should ask is: how long is our longest branch when n is very large? (Let's call this number H(n), the height of our tree after n insertions.) The answer is, unsurprisingly given what I said above about n*log(n) comparisons, something like log(n). In fact H(n)/log(n) converges to a constant alpha that we can calculate.
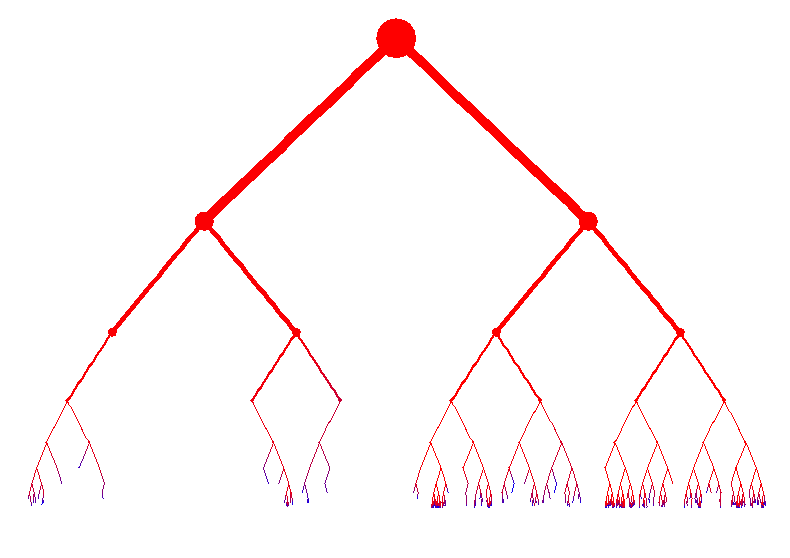
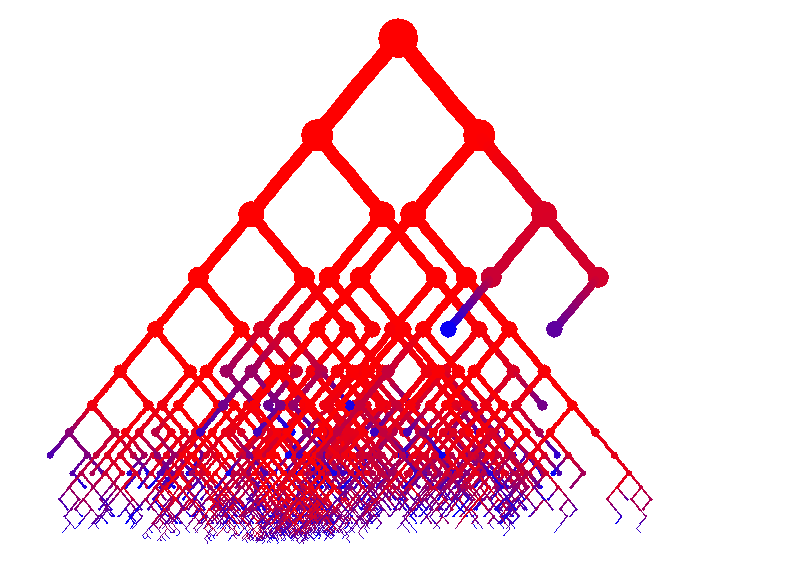
The pictures below are graphical representations of the tree structure of random quicksort. Red nodes were added early on, blue nodes later. The second picture tries to make things look a bit nicer by allowing branches to overlap.


My research
Again, these descriptions may contain inaccuracies in order to keep the discussion at a basic level. If you want a precise discussion, then you'll have to read the papers!
I said above that H(n)/log(n) --> alpha for some alpha that we can calculate. (This holds in probability and almost surely.) Can we do any better than this? Yes - and this might remind you of some branching Brownian motion results. (That's because quicksort has a branching random walk hidden inside it, although you have to embed it in continuous time to see it.) Most of the time H(n) is around alpha*log(n) - beta*loglog(n), for some beta>0 that we can calculate, but occasionally we see a much longer branch, something like alpha*log(n) - beta*loglog(n)/3. And by the way, if we want a lower bound on the number of comparisons we'd better know how long the shortest branch of our tree is. Basically the same result holds as for the longest branch, but with different constants.
Now, if we want our bounds to be more accurate, we might ask how many branches are as long as the longest branch. Let's call this number F_n. First note that every time our height increases by 1, F_n=1. So certainly liminf F_n = 1. We might try running some simulations to see what F_n looks like. See the image below. The blue line shows 2*F_n.

It looks like, after some early noise, F_n settles down. This may be true in some sense, but the only thing I've managed to prove is that limsup F_n = infinity. Michael Drmota has shown that the expected value of F_n is very close to converging to a constant - if it fluctuates then it fluctuates only by about 10^(-9) or something. But we still think it might fluctuate. Or it might not. And F_n might converge in distribution. Or it might not. We're not sure.
See my paper Almost sure asymptotics for the binary search tree.
Going further
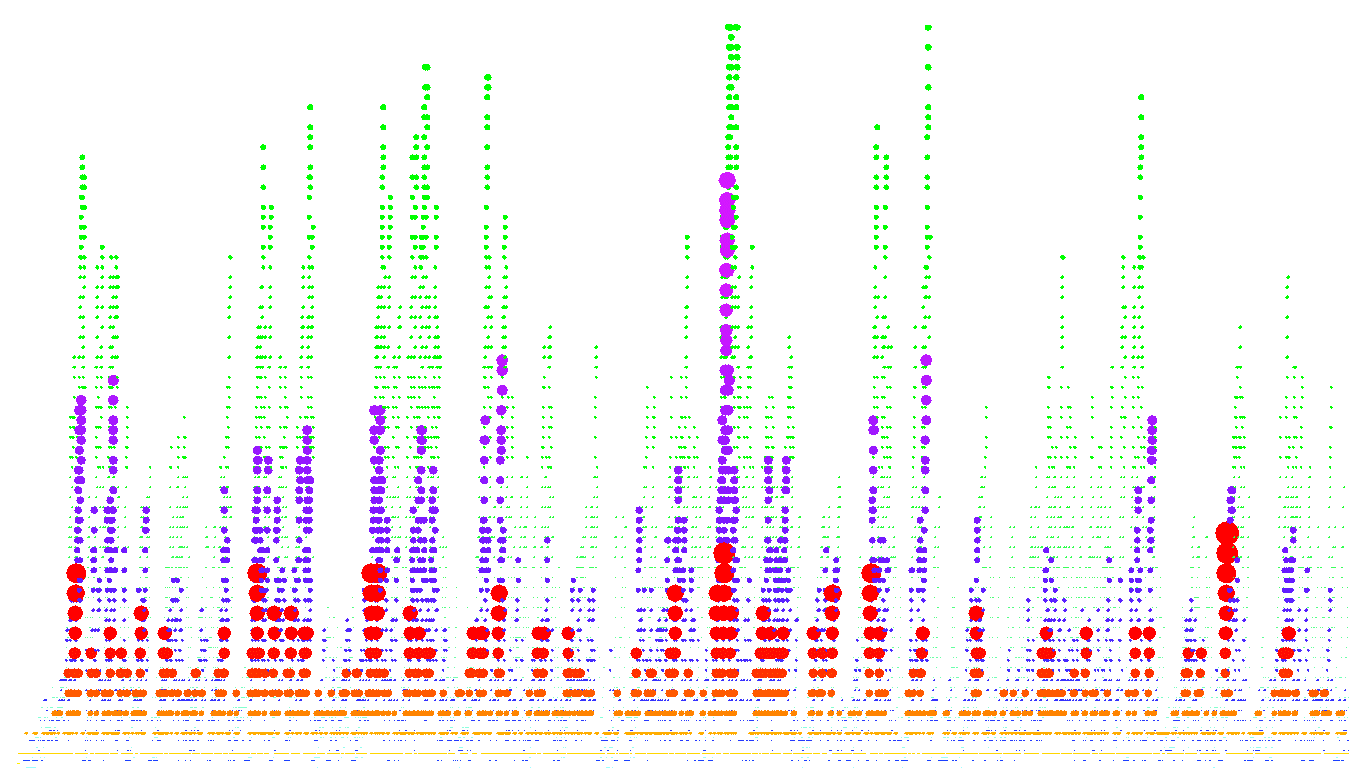
As I said one thing I would like to know is whether F_n converges in expectation or distribution. Another interesting thing to look at might be how many branches have length H_n-1, or H_n-2, and so on. The picture above shows those quantites (or something like them - they might be a factor of 2, or plus or minus 1, off) in red and green respectively.
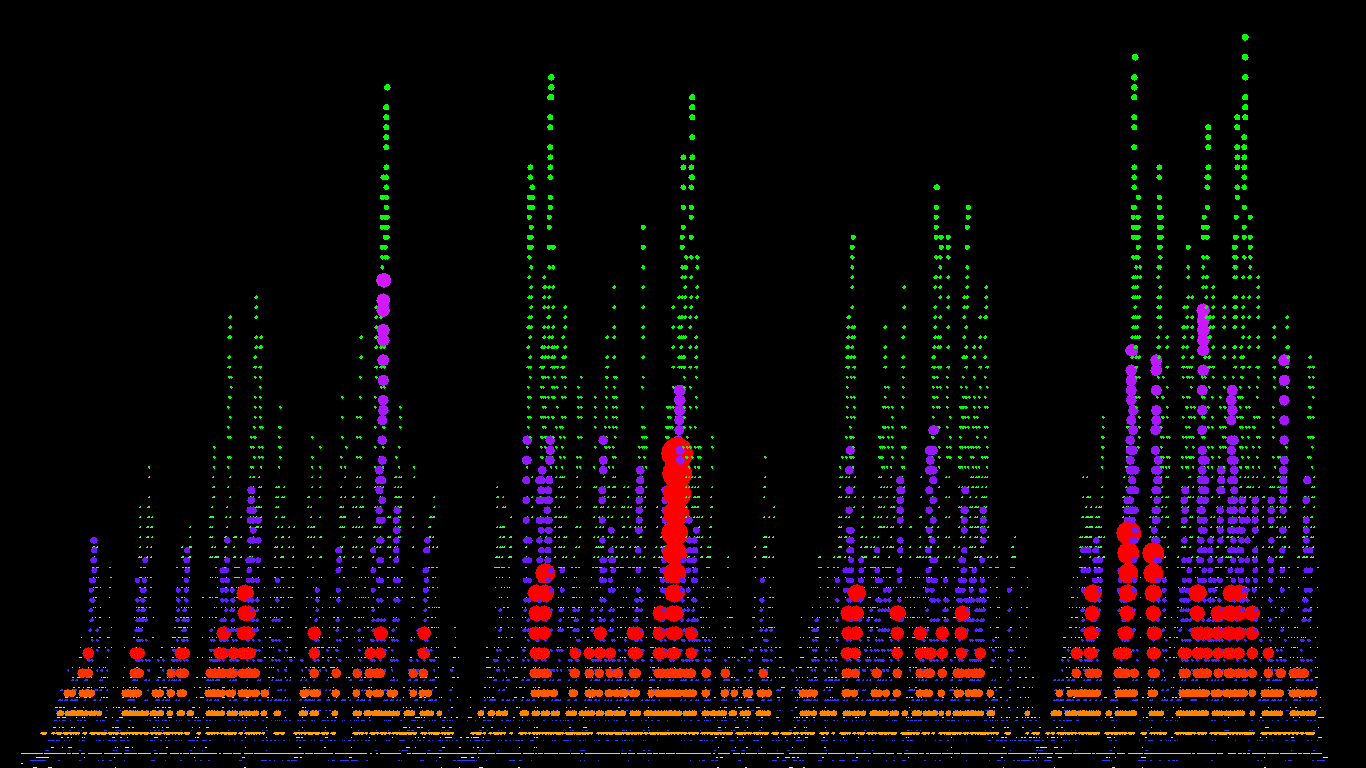
There are some more pictures of the same quantities below that aren't much use but look nice.

