Digital Audio Broadcast (DAB) signal analysis
Dr Robert Watson, Department of Electronic & Electrical Engineering, University of Bath
Digital Audio Broadcast (DAB) signal analysisDr Robert Watson, Department of Electronic & Electrical Engineering, University of Bath |
|
Signals of opportunity for remote sensing
We have been looking at broadcast radio signals as "signals of opportunity" for a variety of purposes. These include so-called passive radar (or passive coherent location, PCL) and remote sensing. This work originally began at Bath through collaboration with Dr Chris Coleman and Heath Yardley at the University of Adeleaide. Using the receiver developed at Adelaide we have been able to sample and analyse of VHF DAB signals (at 222.064 MHz). See my other pages on coverage prediction of DAB transmissions. In the case of passive radar we have been interested in tracking reflected signals from passing aircraft.
More recently we have started looking at how it might be possible to measure refractive index in the atmosphere (which is linked to relative humidity) . This work is being performed with NERC funding under the Technologies Proof of Concept scheme and is in collaboration with the NCAS, Chronos Technology, Met Office and the STFC Chilbolton Facility for Atmospheric and Radio Research. The amount and distribution of water vapour (humidty) in the atmosphere has a significant impact on the formation of severe thunderstorms of the kind that can cause flash-flooding. Current numerical weather prediction models are beginning to operate at grid and time scales where the limiting factor is not one of computation speed but more a problem of the observation data. The aim of this work is to devise a new method of observation based around analysis of DAB signals. A summary paper on the outline of the technique was presented at EuCAP 2010. The slides from this presentation are here.
The receiver hardware
We originally used a receiver developed in house at the University of Adelaide (two-channel 16-bit 100MSPS with a Spartan 3 FPGA for the DSP/DDC). More recently we have used Ettus Research USRP N210 software receivers with BasicRX receivers. These are used with our RF filter/amplifier chain which can be used to directly sub-sample the DAB signal.
Some examples of DAB signals
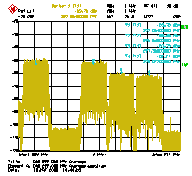
In the UK the DAB often operates in what is known as a single-frequency-network (SFN). This more or less means that every transmitter in the SFN broadcasts the same data at the same time. Depending on how close you are to a particular transmitter, the signals from several transmitters will arrive at the receiver at different times. By analysing this composite signal it is possible to measure the diffence in the time of flight in the signals. In fact this can be done quite easily by computing the signal autocorrelation. The magnitude of the autocorrelation is shown in the top portion of figure below. The x-axis is the autocorrelation lag time (expressed as a distance assuming speed-of-light propagtion c=2.99e8 m/s). The y-axis refers to frame number which is not the DAB frame but data a data frame number as a result of the way in which the data was gathered. The colourscale indicated autocorrelation magnitude in dB (arbitrary units), a correction factor of 20*log10(range) has been added to compensate for the 1/r^2 losses with distance. The lower half of the data shows the corresponding plot of autocorrelation phase.
Peaks in the autocorrelation magnitude indicate the range of transmitters from the receiver (in actual fact it is the difference in the distances between pairs of transmitters, however since the closest DAB was only a couple of km away it is more or less an indicator of distance). The peak at around 25-28km corresponds to the Mendip transmitter which can be seen (on a clear day!) from the roof of the Department of Electronic & Electrical Engineering. Looking at the phase plot (-pi to +pi) for the same range interval the change in phase with time is reduced. Ideally if neither the transmitter nor receiver clocks drift AND the atmopheric refractive index along the propagation paths remains constant, the phase should not drift. This sample data was collected with a free-running receiver sample clock - although we are now working on signal processing methods to filter out phase variations and also investigating the use of single- and dual-frequency GPS techniuqes either to discipline the receiver sample clock or to post-process correct the phase. The aim of the project is to eliminate all phase variations except for those corresponding to the propagation path effects
Here are some interesting animations of DAB autocorrelation phase and magnitude data (warning some of these files are quite large)
Other things we are exploring...
This is very much a work in progress and there are are many things that I have glossed over. These short paragraphs are by no means the complete picture - the ambiguity function of DAB is not ideal and multipath can be a problem. Multipath can occasionally be seen as structures in the autocorrelation at low-range lags (a few km), the non-ideal ambiguity function means that the peaks in the autocorrelation are also a bit fatter than we'd like. The autocorrelation process is really a "channel sounder" allowing you to see the channel impulse response albeit for a fairly narrow (1.536MHz) bandwidth DAB signal. We've also started to look at using DVB-T which has a larger bandwidth which may help... there's at least four PhD projects worth of work in trying to understand what's going on here. If anyone makes it this far down the page and is interested, please do contact me! See also the ad on findaphd.com.