QR code
In this lab, you’ll take an existing piece of badly-written code and speed it up.
Description
The European Union’s IAGOS international research programme collects measurements taken by scientific instruments fitted to passenger aircraft. These data are used to improve weather forecasts and for scientific research on the climate system.
In this lab, you will use data recorded by one of these aircraft - specifically a flight from Johannesburg (South Africa) to Vienna (Austria) on the 25th of October 2019. You will use these data to answer several questions (‘Tasks’, described below) about the flight and the winds it encountered along its flight path.
Data and Functions
The zip file below contains:
- a PDF copy of the instructions.
- A Matlab script (‘aircraftlab2024.m’) that you will need to edit to complete this lab.
- A Matlab data file (‘aircraftdata.mat’) containing the aircraft data, that you should not edit.
- A Matlab script (‘addwindcolours.m’), that you should not edit.
Objectives
Your final copy of this function should complete as many as possible of the tasks listed below, and run in as short a total time as possible. You are aiming to optimise for:
- competing the Tasks in the lettered list below (’accuracy’)
- the total run time of your code relative to everyone else (’speed’)
All Tasks except G and H are already done by the code before you start, will be correct if the final version produces the same output for this task. Tasks G and (especially) H are more difficult than the others.
The Tasks
Your final piece of code should:
-
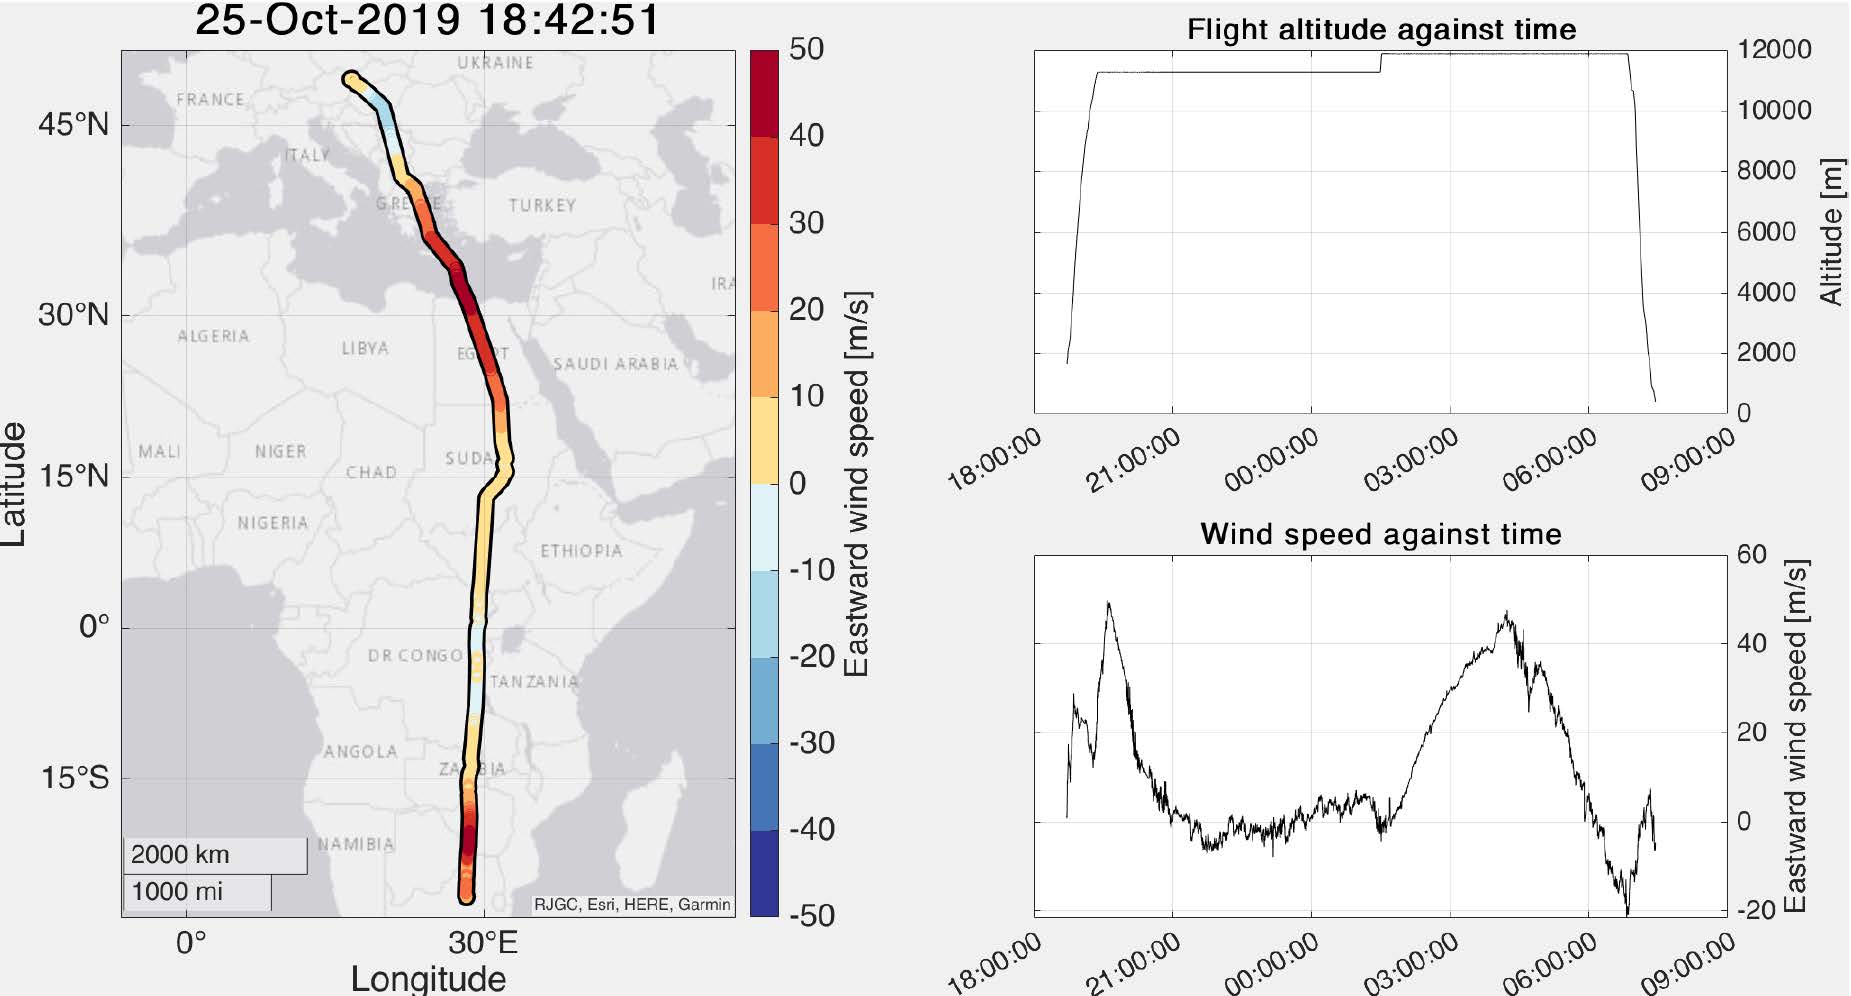
Task A: plot a map of the aircraft route using the geoscatter() function with colours for wind speeds. Include axis labels, a title showing the flight take-off time, and a colour bar. The final version should look as similar as possible to the example shown at the bottom of this document.
-
Task B: plot graphs of flight altitude against time and wind speed against time, again as similarly as possible to the examples below. Include a title and a labelled y-axis for each graph.
-
Task C: compute the total flight time in hours and put it in the variable FlightTime. This should be accurate to the nearest hour.
-
Task D: compute the average flight speed, and put it in the variable Speed. This should be accurate to the nearest 10 m/s.
-
Task E: compute the total distance travelled, in km, and put it in the variable FlightDistance. This should be rounded to the nearest 100km.
-
Task F: compute the fastest westward (i.e. negative-valued) wind speed, and put it in the variable MaxWestSpeed. This should be accurate to the nearest 1 m/s.
-
Task G: find the maximum speed of the region of high wind speed over the Eastern Mediterranean Sea/Egypt and put it in the variable MaxJetWind. This should be accurate to the nearest 1 m/s, and should be an absolute value (i.e. without the minus sign).
-
Task H: find the latitude and longitude of this local maximum wind speed, accurate to the nearest degree in lat and lon, and put them in the variables JetMaxLat and JetMaxLon respectively.
Expected Results
- Tasks A,B: see figure below
- Task C: 10 hours
- Task D: 240 m/s
- Task E: 8700 km
- Task F: 22 m/s.