Green Screens
This lab script describes an image processing problem that you should solve using MATLAB. Solving this problem will allow you to claim Programming in MATLAB at the Application level.
Objectives
By the end of this activity you will:
- Understand how digital images are represented,
- Be able to apply your problem-solving skills to new problems,
Introduction & background
Digital photos are pervasive in our culture. Greyscale images can be represented as two-dimensional arrays (matrices), the value of each point giving the shade of grey, normally ranging from 0 for black to 255 for white. The individual points are often referred to as picture elements or pixels. A similar representation is used for colour images, though there are different ways that the colour is represented.
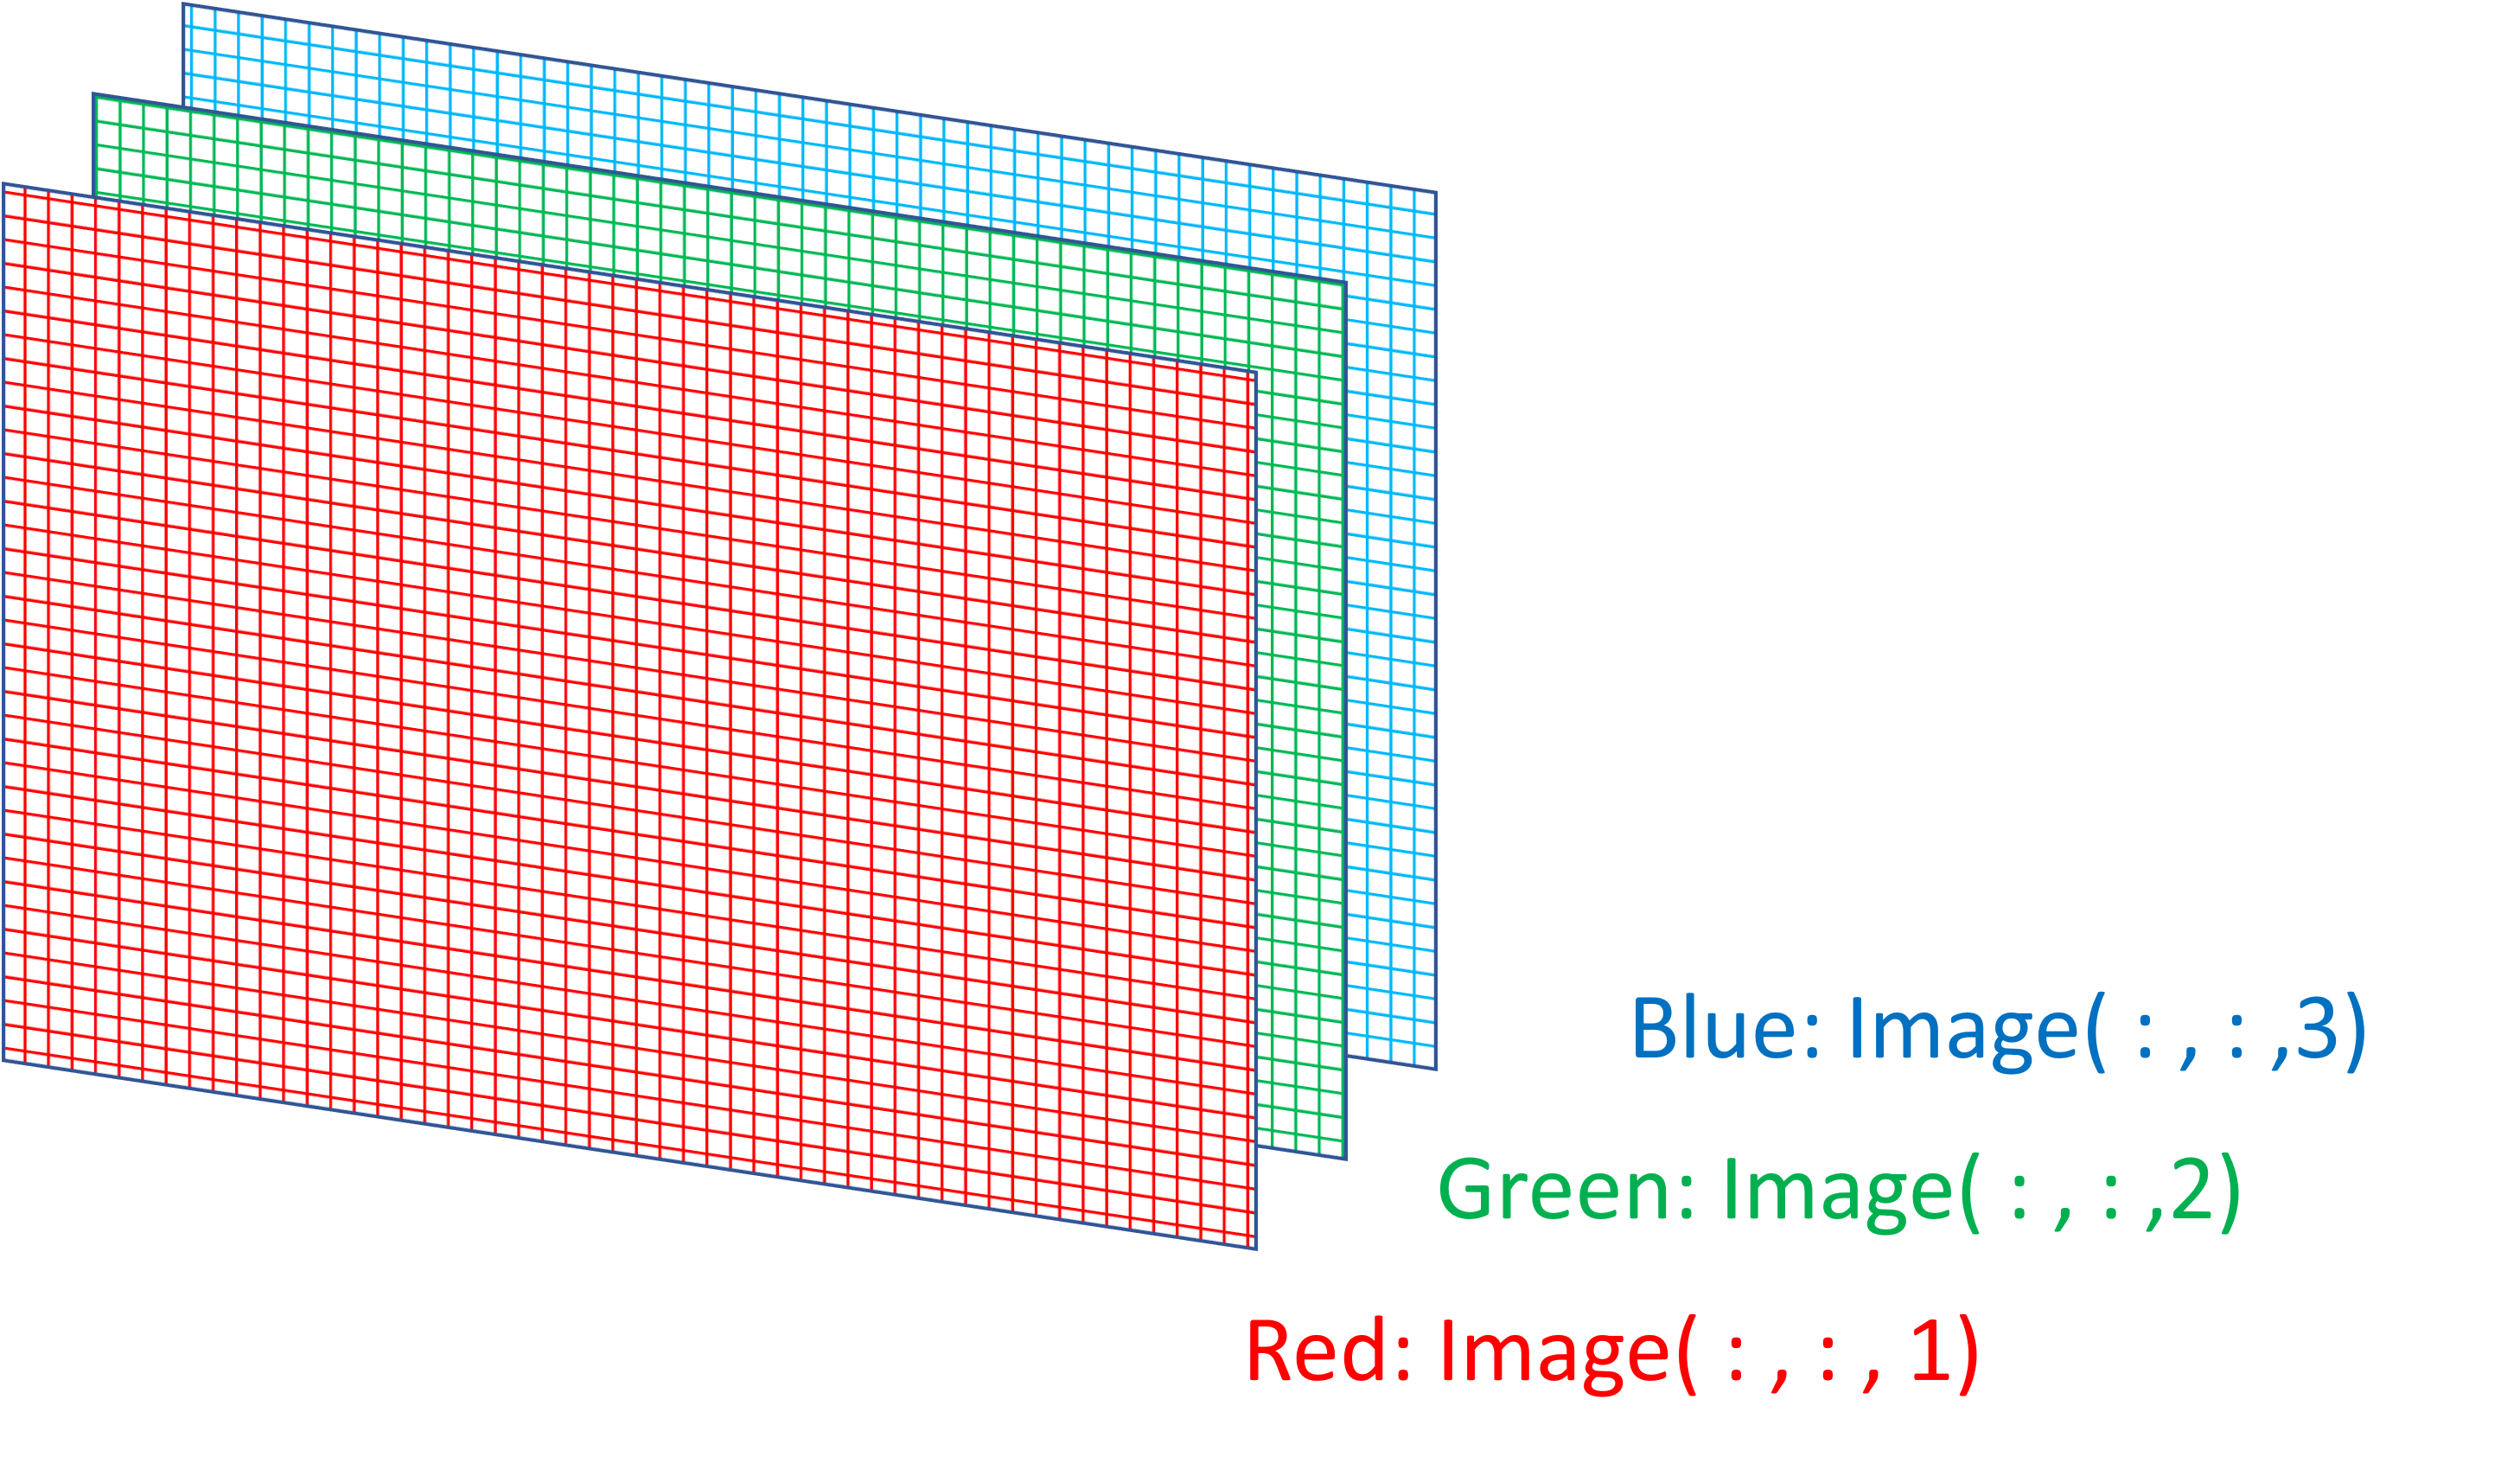
One method is to have three different values stored for each pixel, with each giving the intensity of red, green and blue at each point in the image. Within MATLAB such an image can be represented by a three-dimensional array of numbers, where each page can correspond to a different colour, as represented visually in .
The technique of green-screening, or blue-screening is often used in TV and film for moving images. This is where a subject is filmed in front of a screen which is saturated with one colour. More details can be found on Wikipedia but this goes into a lot more detail than you need for this activity, and the programming aspects are a lot more complex than required here.
The aim of this activity is to create code in MATLAB to overlay a foreground image taken with a green-screen onto a background image. The exercises are of increasing complexity with the final one resulting in code that can flexibly position a green-screen image on a background photograph.
Task 1
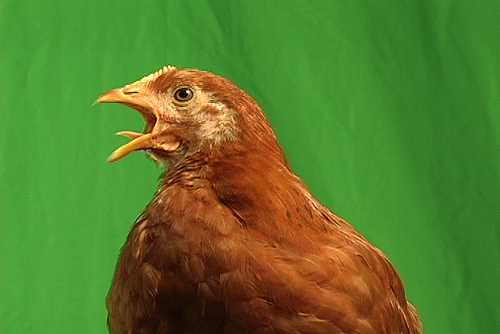
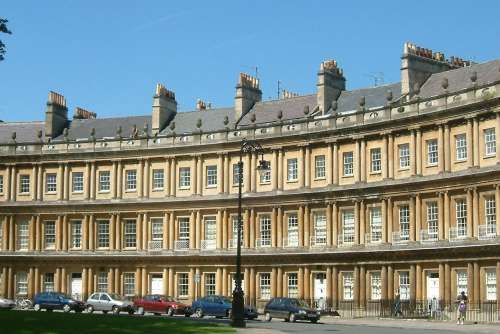
and are two examples of colour images that you will use in this activity.
-
Create a script to load up the test green-screen image (bird.jpg) and the background image (Bath.jpg) using the
imreadcommand. Note: click on link and ‘Save image as…’ to your computer. -
Plot the images side-by-side using the
imshowandsubplotcommands and add titles to the images. -
Explore the foreground image using the data browser to see what values are associated with each pixel.
Task 2
Create a function that will determine whether an individual pixel is part of the green-screen.
The function should look like:
function [isG] = is_green(Pixel_RGB_vector)Your function should have as an input argument a vector (Pixel_RGB_vector) with three values corresponding to the red, green and blue component of the pixel.
i,e, Pixel_RGB_vector= [R G B] e.g. [54 189 94]
The output argument, isG, should be 1 (True) if the pixel is part of the green screen and 0 (False) if not.
Note: the colour data is stored in memory by MATLAB as an unsigned integer (uint8). This means that each element can have an integer value between 0 and 255. i.e. no negative numbers. If you want to do operations on these numbers that give answers without these restrictions, you need to tell MATLAB to store the data in memory in a different way. Find out what the command single does.
Test the algorithm with different RGB values from the test image. Is the value of isG correct?
Task 3
Create a function that will output an image ‘mask’ from the input image.
The image mask will be a matrix of the same size as the input image. Each element will contain a 1 (True) or 0 (False) depending on whether the corresponding pixel is part of the green screen.
[Mask] = create_image_mask(Image)Ensure that Mask is of type uint8.
Task 4
You now have the main ingredients for creating your full programme:
- Create a script to load the bird.jpg foreground image and Bath.jpg background image from separate image files.
- Use the image mask to cut-out the foreground from the green screen image.
- Combine the cut-out foreground image to create a single combined image called Composite.
- Plot the original images along with the mask and composite images in a 2x2 array of plots.
Task 5
In Task 4, there are limitations to the images that you can use. In particular, they must be the same size, and you cannot scale the foreground image relative to the background.
I have provided a function called resize_image.p which can change the dimensions of an image, i.e. the number of pixels in width and in height. (Right click on the link and ‘Save link as…’ to save the function to your computer)
The file extension for this is .p. This is similar to a .m file, and you can call the function in a similar way but you cannot see the code behind it.
The function looks like this:
[ Image_Out ] = resize_image( Image_In, newwidth_pixels, newheight_pixels )In this task you should use this resize_image function to allow the foreground image to be resized and repositioned within the background image.
Your code will be tested with different values of the two variables:
- newsize is a vector of two elements for the new width and new height in pixels;
- newposition is a vector of two elements corresponding to the position of the top left hand corner of the foreground image in the background image. Note: the top left hand corner of the foreground image will always be in the final image.
e.g.
newsize=[150,100];
newposition=[10,10];Note: The resolution of the background image should not be changed, and your composite image contained in the variable Composite should have exactly the same dimensions as the background image and be stored as 8-bit unsigned integers (uint8).
Checking if your code works
You can use MATLAB Grader to give you automated feedback for your code and a determination as to what extent your code works.
Instructions reminder
- You should develop your code outside of MATLAB Grader so that you can run your own tests and be able to monitor the workspace.
- When ready to test, you should copy your function or script into the relevant code section.
- You can then run your script or function to see if any errors are thrown and also any ‘pretests’.
- When you are confident that your code satisfies the requirements, you can ‘submit’ your code. This will run all the automated tests of your code and give you an evaluation and possibly some more feedback.
Providing evidence that your code works
Alongside images demonstrating your tasks functioning correctly, you can use screenshots from MATLAB grader to validate that your code is successful as previously shown in The Zeller Congruence activity.
Note that it is not necessary to show evidence of earlier, simpler tasks if the later, more complex, tasks function correctly.