AC Sweep Analysis and Filter Design
Introduction
This CAD (computer aided design) laboratory session is intended to familiarise you with examining how to display the variation in magnitude and phase of quantities in circuits involving R, L and C components over a range of frequencies. This is termed AC sweep analysis since voltage or current magnitude and phase will be plotted while the frequency of an AC input oscillator is ‘swept’ (i.e., continuously varied) over a range.
Also, a transient analysis of a filter circuit will be performed to check that a filter circuit is operating as expected.
AC Sweep Analysis
How voltage and current magnitude and phase change with frequency for a circuit is viewed from graphs of voltage (or current) magnitude and phase against frequency. A logarithmic scale is normally used for the horizontal frequency axis because very wide frequency ranges are often covered.
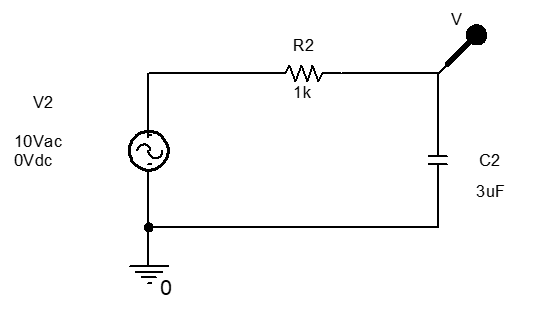
Open a New/Project file in OrCAD/PSPICE and enter the circuit shown in . Remember to edit component designators and values so that your circuit is the same as .
- Voltage source from SOURCE library as VAC (not VSIN).
- Resistor and capacitor from ANALOG library as R and C.
- Earth symbol, using earth right-side-of-screen button, and select SOURCE, then select 0.
Add a voltage marker after you have set up the simulation profile as described below to view the capacitor voltage.
Edit the Simulation Profile within the PSPICE menu and change the Sweep Parameters as follows: Within the Simulation Settings dialogue box, set:
- Analysis Type: to AC Sweep/Noise
- Start Frequency: to 1Hz
- End Frequency: to 10 kHz
- Points/Decade: to 100
- AC Sweep Type to Logarithmic
- Run the simulation and view the output in the plot window.
- From the Plot menu, select Plot/Add Plot to Window.
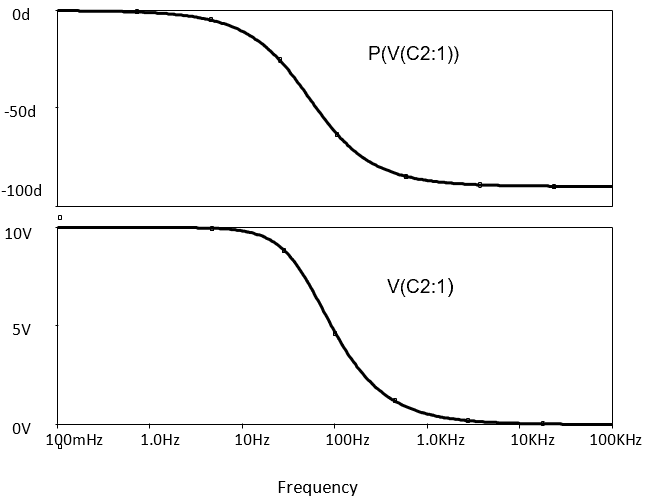
To add the phase response, select Add from the Trace menu. On the right side of the Add Traces window scroll down within the Function or Macros section to P( ). Click on this and on V(C2:1) to insert between the brackets, and then click on OK.
The variation in the phase angle of VC2 relative to VS is then added to the plot as illustrated in .
Clearly the capacitor approximates better and better to an AC short circuit as the frequency increases because the capacitor voltage magnitude reduces to a very low value as the source frequency increases.
Filter Design

Add the following circuit in to your ORCAD/PSPICE worksheet and edit the simulation profile to per-form an AC sweep analysis between 10Hz and 100 Hz using 1000 points per decade.
Exercise 2
Use the plot window cursors to measure resonant frequency and upper and lower cut-off frequencies. Use these values to calculate the bandwidth for the circuit.
- $ f_o = $
- $ f_{cl} = $
- $ f_{cu} = $
- $ BW = $
How do these values compare with your calculated values?
Exercise 3
Calculate a different value for the inductor in to make the filter circuit suitable for blocking a 50 Hz AC mains interference signal, induced in a telephone cable when power and telephone cables are routed in the same conduit by an industrial trainee for 1km, despite clear instructions from Susan Hay, the chief engineer, to keep them well separated. Calculate the new value of bandwidth.
- $ L = $
- $ Q = $
- $ BW = $
Exercise 4
Change the inductor value on your OrCAD/Capture worksheet and confirm by simulation that your new filter circuit is suitable.
- $ f_o = $
- $ f_{cl} = $
- $ f_{cu} = $
- $ BW = $
Transient analysis of filter circuit efficacy
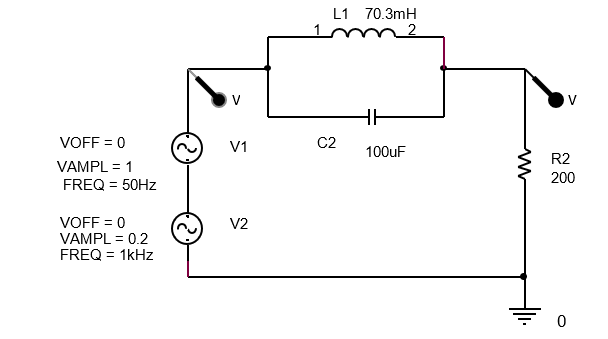
Enter the circuit shown in into a new OrCAD/Capture project file. Remember to edit component designators and values so that your new values replace those shown in .
- Voltage source from SOURCE library as VSIN (note not VAC).
- Resistor and capacitor from ANALOG library as R and C.
- Earth symbol, using green-earth right-side-of-screen button, and select SOURCE, then select 0.
Add voltage markers to the input and output of the filter.
Prepare to run PSPICE to simulate circuit operation by setting up a simulation profile, i.e., from the menu bar select PSpice/New Simulation Profile, set the Name to AC-trans, and click Create.
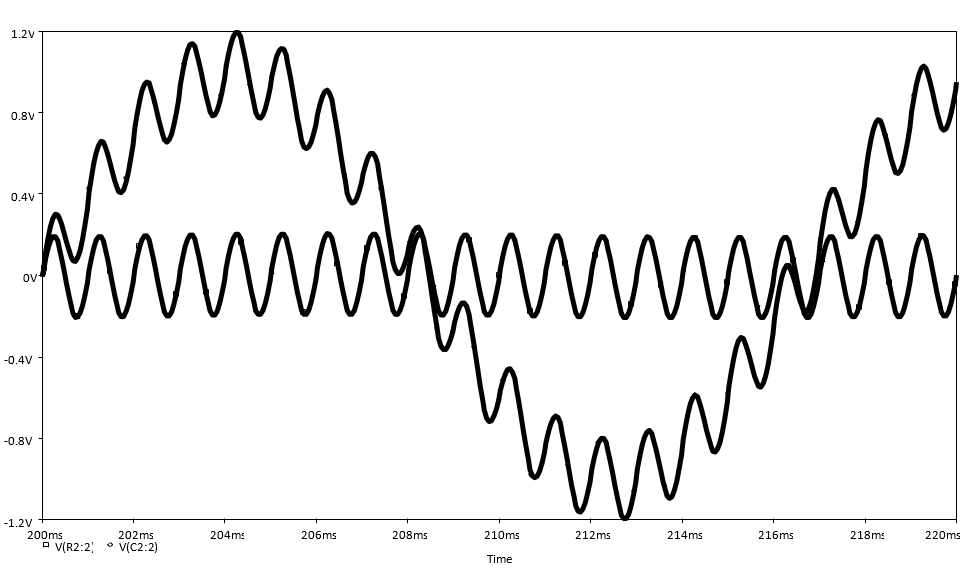
Within the Simulation Settings dialogue box select the Analysis frame and set the Run to time to 220ms, Start saving data after to 200ms and the Maximum step size to 0.05ms.
From the menu bar select PSpice/Run or click on the blue arrow on the second from top toolbar, which also starts PSPICE running.
Waveforms similar to those shown in should be obtained in the plot window.
Exercise 6
From what you have learned, design a filter circuit which only passes the 50 Hz interference signal so that you may study its characteristics. Test your circuit using transient analysis as previously used.
Sketch your circuit and the required component values.
Show your filter input and output waveforms to a lab supervisor so that he may sign your lab notebook to confirm that you have designed an effective filter.
Exercise 7
Clearly explain how aspects of the filter performance would change if significant source and inductor resistance were taken into account.
Reflection on skill and learning
Complete outside the lab if you run out of time in your lab notebook. Comment on your individual attainment as suggested below.
What percentage of the lab work did you complete? How do you rate your participation as a lab group member?
What level of proficiency do you feel you achieved in analysing, designing, and testing 2nd-order filter circuits. Choose one of the following and add a comment.
- High – confident in predicting the filter response of resonant-circuit filters and manipulating the cir-cuits to obtain specific filter specifications. In future, will be able to apply in —- and size —–?
- Medium – some further practice required but have reasonable understanding of the form of 2nd-order filter response, how to achieve different filter characteristics and performance specifications. More practise especially in required in —–?
- Basic – can follow the simulation process to get filter characteristics but need greater individual practice to master some aspects of filter synthesis and design. The main obstacles to more confident circuit simulation, design and analysis are —–?
List two or more ways in which attending and completing the lab work has been of value.
List any suggested changes to the lab work that you identified which would facilitate circuit theory learning and acquiring AC-sweep circuit simulation and filter response identification and analysis skills.