General Information
Over the past five decades, satellite development and deployment has increased exponentially. This allows us to observe the Earth in far more detail than ever before. Giving rise to globally important advancements in science, such as mapping natural catastrophes, monitoring climate change, improving weather forecasting, and the impact of humans on our planet.
In this project, you will explore data from the European Space Agency’s Climate Change Initiative (ESA CCI). This dataset is the result of a multinational collaboration to provide long-term, high quality climate data records from satellite observations. ESA CCI merges observations from 100+ satellite instruments to create a standardised dataset of variables such as fire coverage, ozone concentration, sea-ice cover, sea level, and land use. This data helps scientists understand and predict changes in key climate variables.
Your task is to download, process and plot data to investigate the changes of these variables with time/location using MATLAB, researching connections between variables, and making aesthetic maps to convey your science effectively. This project will introduce you to working with many Terabytes of real data, a highly desirable skill.
Outcomes
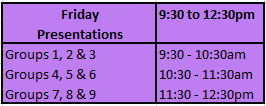
You will be presenting a 10 minute group presentation plus 5 minutes for questions on Friday morning. Please see the presentation schedule for your timings. One group will be nominated to give their presentation a second time in the Friday afternoon wrap up session.
Please pick a climate change initiative variable from the ESA CCI (Climate Change Initiative) dataset to focus on.
Answer the following questions in your presentation:
-
What does a map of the variable show you?
-
How does this variable change in time? (e.g. daily, monthly, yearly)
-
Where does the data come from?
-
Research the satellite (it’s orbit/launch dates)
-
Research and describe the instruments (how it works/ how the data is derived)
-
You could also explore:
-
Focussing on specific geographical regions
-
How two variables from ESA CCI relate to each other
-
Long term trends
-
Statistical analysis
-
Animations!
-
Specific events e.g. Australian wildfires
-
Researching the reasons behind the changes you see in your variable.
Logistics
Earth observing datasets (especially ones which span many years) can be very large. For this reason, each of the computers in this room have had a 512GB hard drive installed for you to download your data to. Please bear in mind that if you would like to do any coding outside the lab, you will need to download small amounts of data locally to do this. It also means that if you move computers within the lab, you will not have access to data you have put on that hard drive.
Each group has one assigned computer which they have priority on to access their data.
Skills Mapping
Group Size and Allocation
Groups consist of 5 or 6 students. The allocations can be found here.
Timeline
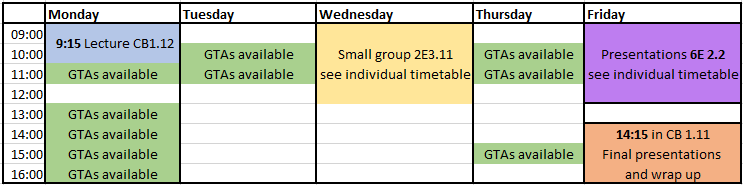
While you are free to use the lab (2E2.16) throughout the entire week during lab opening hours, there are dedicated times where demonstrators will be available to help.