Intro to Pulse Oximetry
Author: Dr B. Metcalfe
Overview
Photoplethysmography (PPG) is a non-invasive optical technique employed for the detection of blood volume changes within the microvascular tissue bed. It operates on the fundamental principle that blood exhibits varying light absorption characteristics in comparison to surrounding tissues. In particular, PPG commonly utilises light within the red and infrared spectrum, as these wavelengths are effectively absorbed by blood.
The typical configuration of a PPG device includes a light source and a photodetector. The emitted light penetrates the skin, and the subsequent measurement by the photodetector captures alterations in the intensity of the transmitted or reflected light. This dynamic process is a consequence of changes in blood volume associated with each cardiac cycle, culminating in the generation of a photoplethysmogram—a graphical representation of these variations.
The applications of PPG are diverse. Primarily, it is employed for heart rate monitoring by discerning pulsatile changes in blood volume corresponding to each heartbeat. Furthermore, PPG can be utilized for the estimation of oxygen saturation levels by assessing the absorption of light at distinct wavelengths. Additionally, some applications extend to the estimation of blood pressure changes.
Integral to various medical devices, such as pulse oximeters, fitness trackers, and other wearables, PPG facilitates real-time and continuous monitoring of physiological parameters. Its non-invasive nature means that it is a comfortable and secure method for prolonged monitoring.
Despite its advantages, PPG has several inherent limitations. Indirect measurements may not match the precision of more invasive techniques, and external factors such as ambient light and skin pigmentation can influence accuracy. Nonetheless, the utility of PPG in providing continuous and real-time physiological monitoring remains significant in multiple medical and wearable technology applications.
Pulse Oximetry
One of the primary applications of PPG is the measurement of blood oxygen saturation. This measurement relies on the differential optical absorption and reflection characteristics of oxyhemoglobin (oxygenated blood) and deoxyhemoglobin (deoxygenated blood). These differences are shown in .
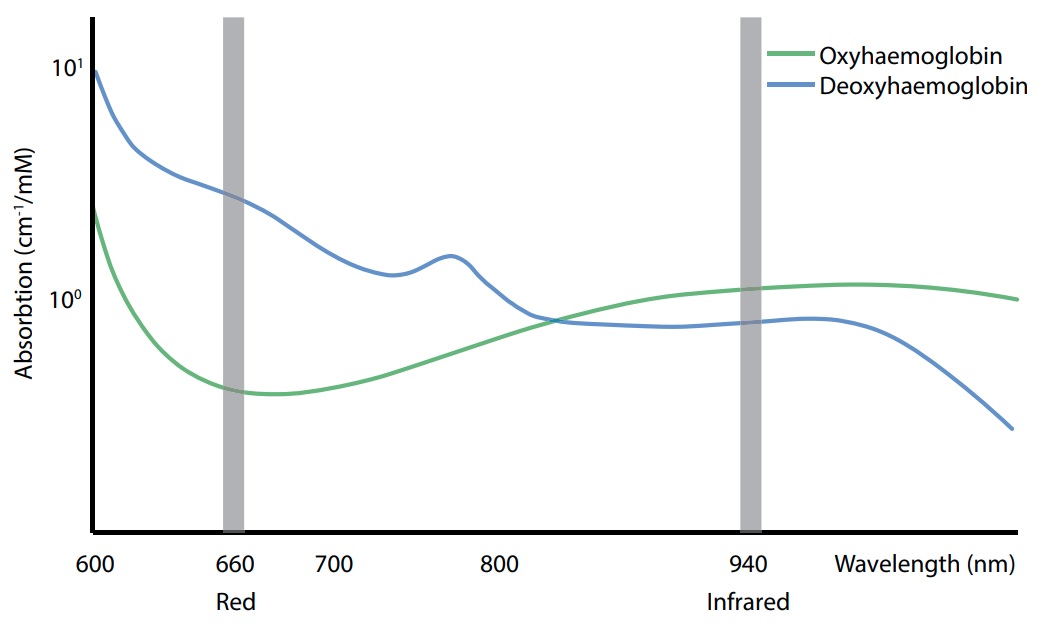
The absorption spectra, encompassing the Red and Infrared spectrum, reveal that while both types of blood exhibit similar absorption under infrared light, deoxyhemoglobin absorbs significantly more red light than oxyhemoglobin. Consequently, by assessing light absorption at these two wavelengths and comparing the results, the relative oxygen levels in the blood can be ascertained. Given the penetrative capability of both wavelengths through the skin, external sensors can be utilised for this measurement.
There are two main modes of operation. In reflection mode the light sources (typically LEDs) and the photodetectors (typically phototransistors) are mounted on the same substrate and the amount of Red and Infrared light that is reflected by the tissue is measured. In transmission mode the light sources and the photodetectors are placed either side of a boyd of tissue, such as the finger, and the amount of Red and Infrared light that is absorbed by the tissue is measured. In all cases the photodetector and the light sources are matched so as to permit measurement at the specific wavelengths of light.
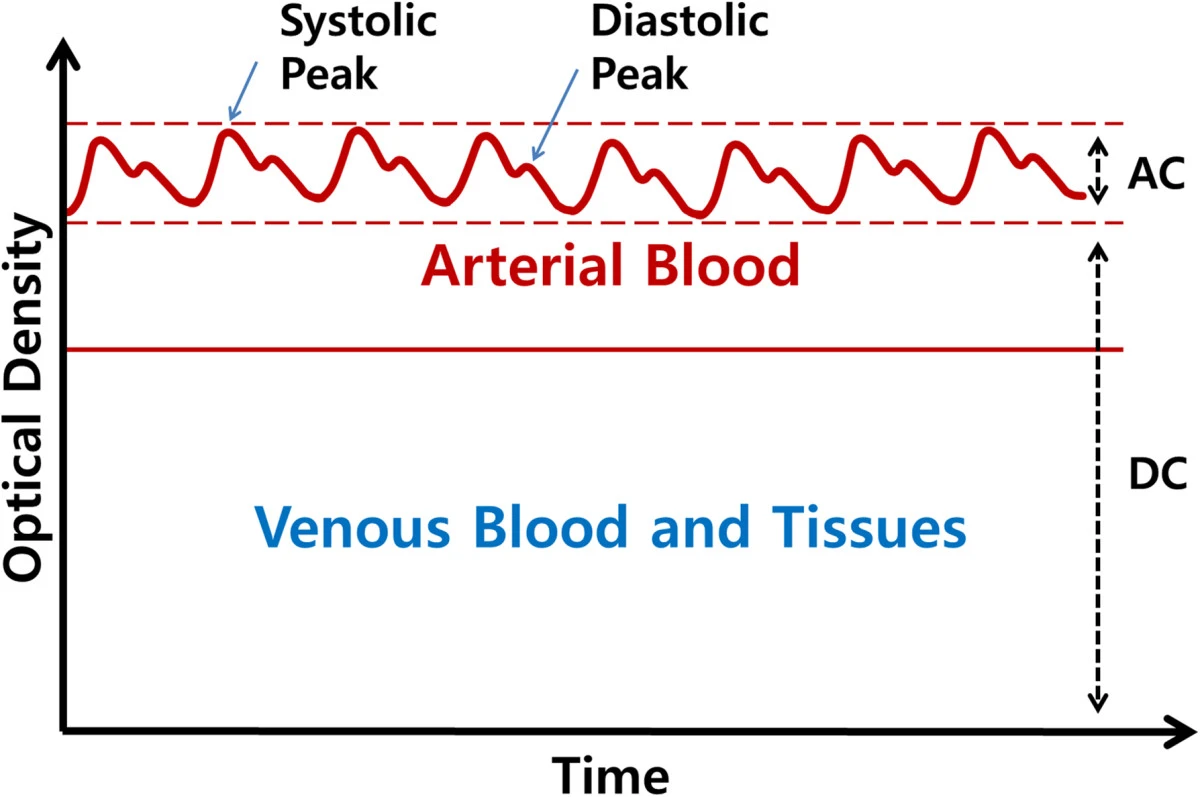
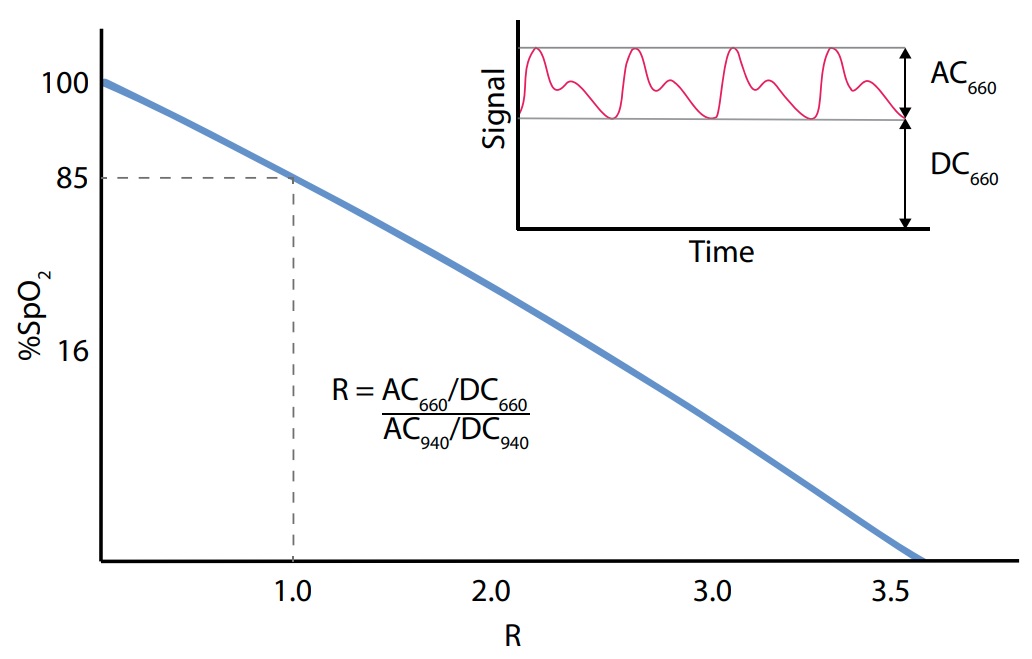
Typically, measurements are taken in areas with thin skin and minimal organ interference, such as the fingertip or earlobe. Once the levels of reflected or absorbed Red and Infrared light are measured, the ratio $R$ is calculated to determine the subject’s blood oxygen levels. Mathematically, this ratio is defined as:
\[\begin{equation} \label{eq:exampleEquation} R = \frac{AC_{660}/DC_{660}}{AC_{940}/DC_{940}} \end{equation}\]An empirical calibration curve then relates the $R$ ratio to arterial oxygen saturation $SpO_2$, providing a quantitative measure of blood oxygenation.
Additional Resources
Further information on designing pulse oximeters can be found in the following document by Texas Instruments: