Wind Tunnel and Testing Equipment
This section introduces you to the wind tunnel and the associated testing equipment that can be used for assessing the performance of your mini wind turbine designs. The wind tunnel is a vital tool that simulates various wind conditions under controlled settings, enabling a thorough evaluation of how different wind speeds affect the energy harvesting capability of your turbines.
The Testing setup
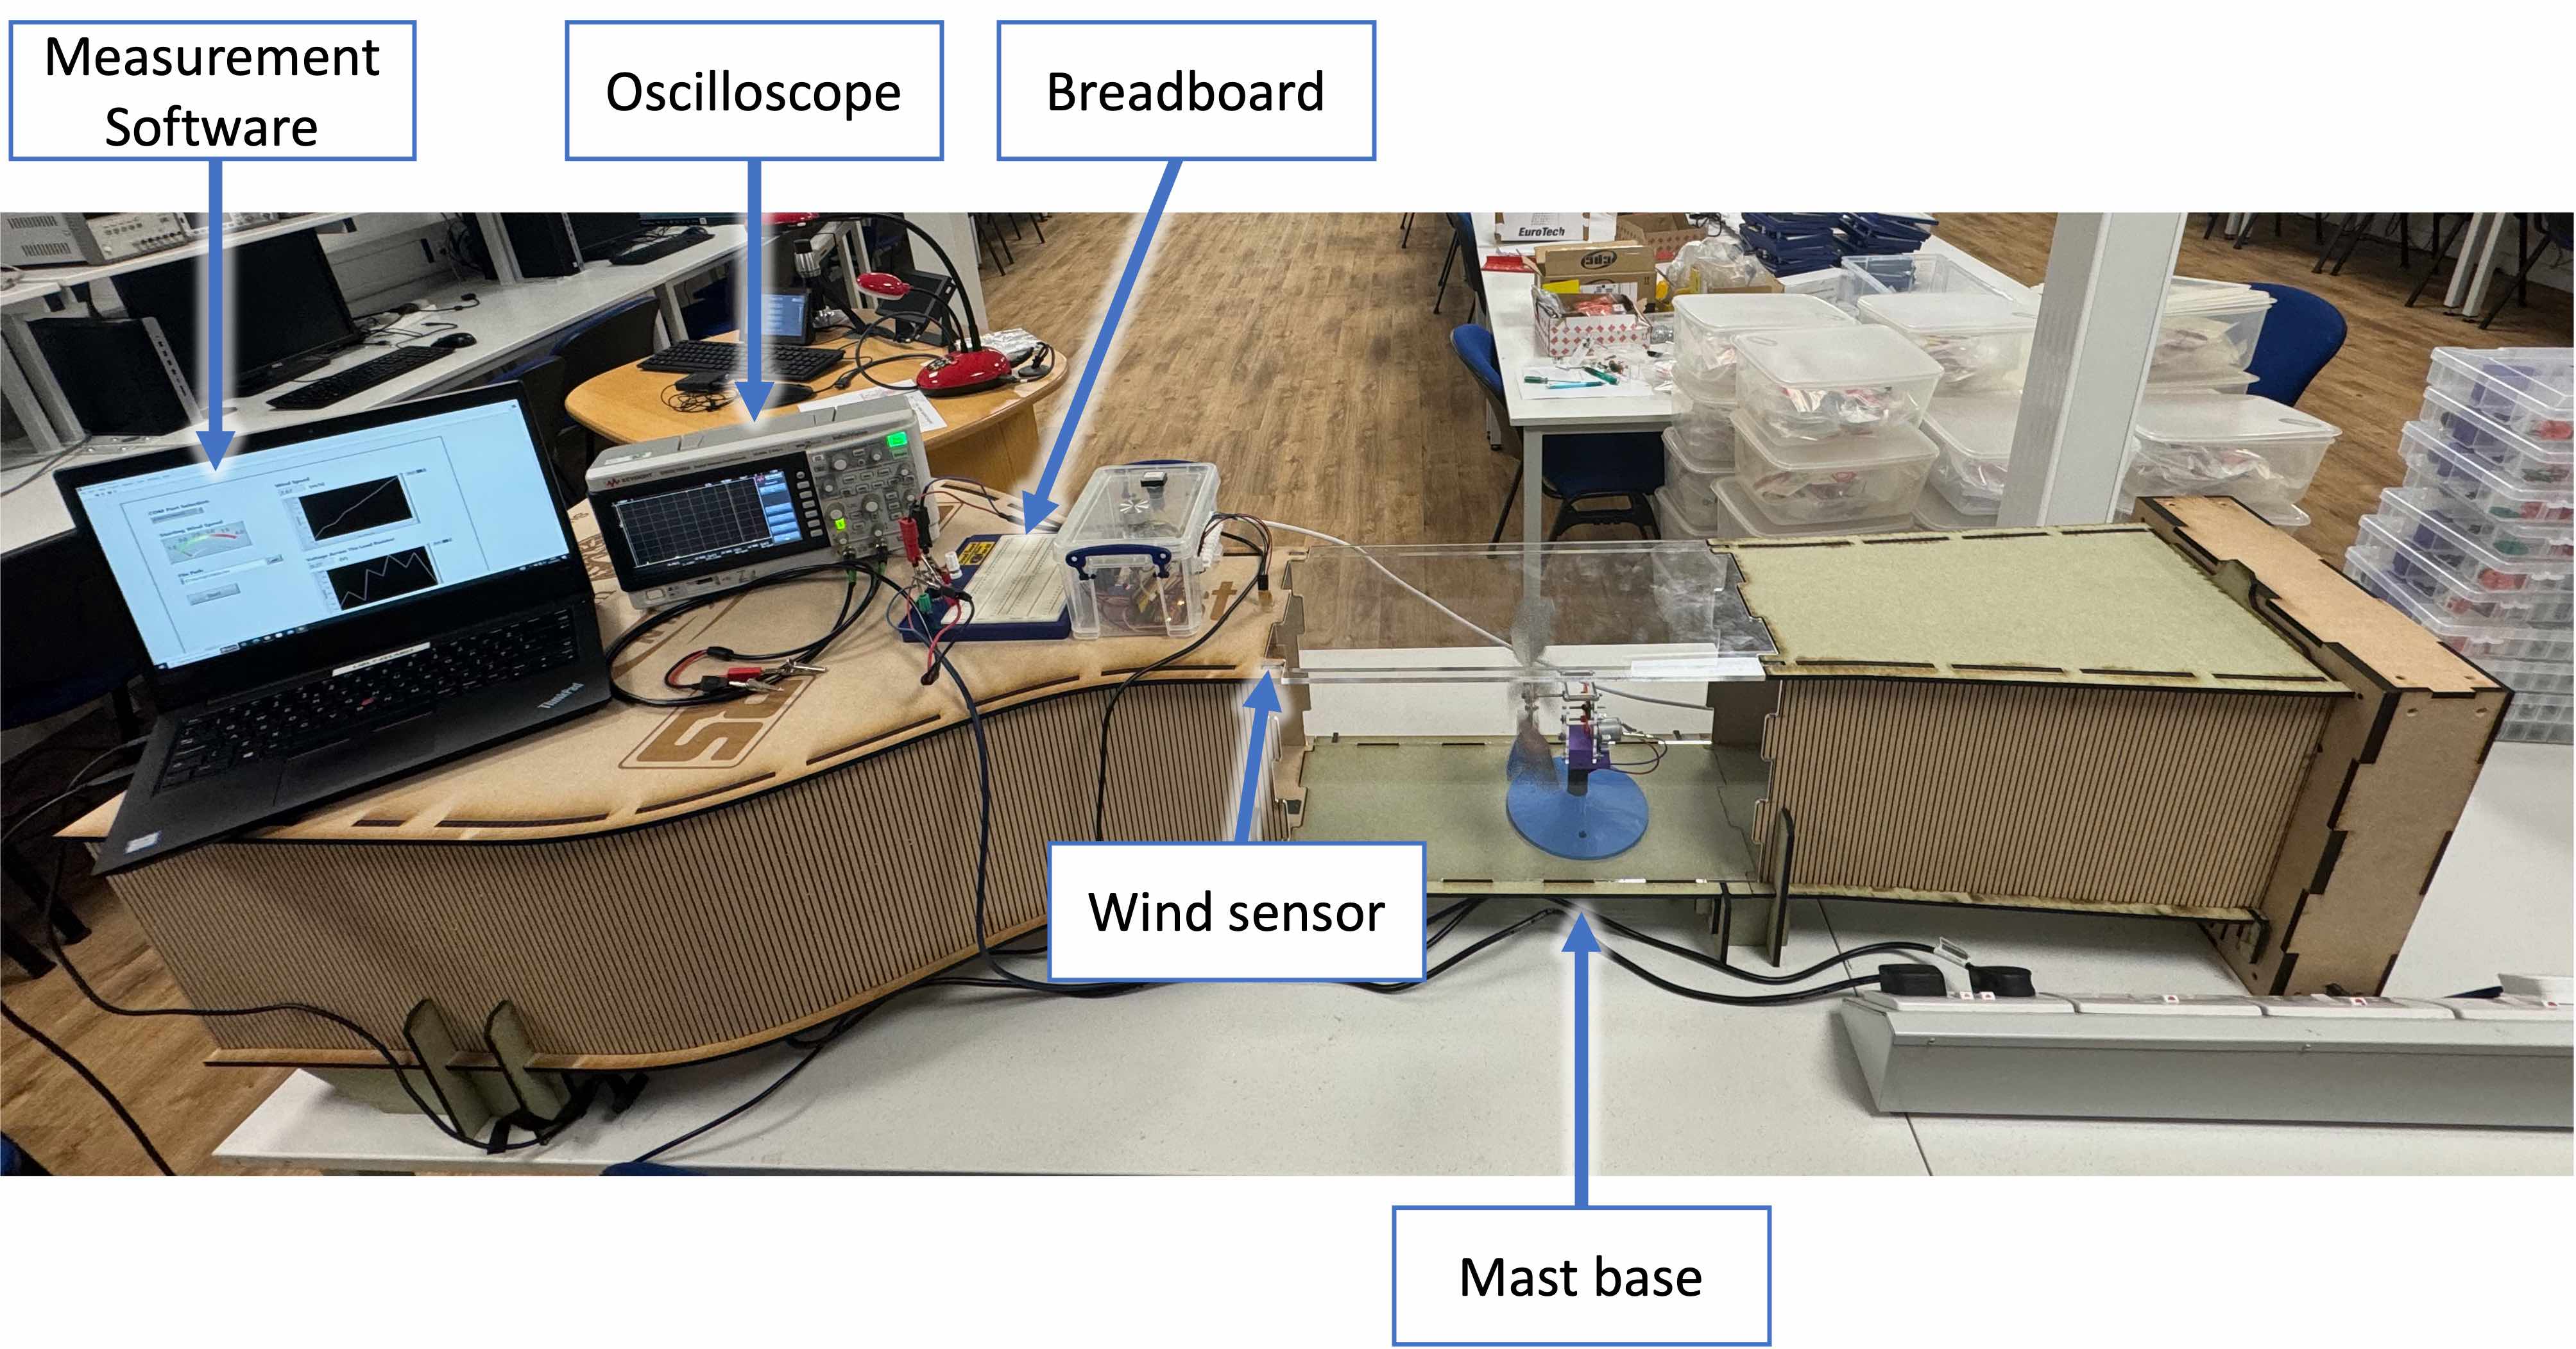
The testing setup includes the following:
- Wind Tunnel which is controlled through the measurement software to simulate wind at a range of speeds.
- Mast base which is used to hold the wind turbine.
- Wind sensor which measures the wind speed inside the wind tunnel.
- Oscilloscope that can be used to view and save the waveform of the electrical signal generated.
- Measurement software that uses the readings from your circuit (on the breadboard) and input from the wind sensor to output a csv file that includes tabulated values of voltage at a range of wind speeds.
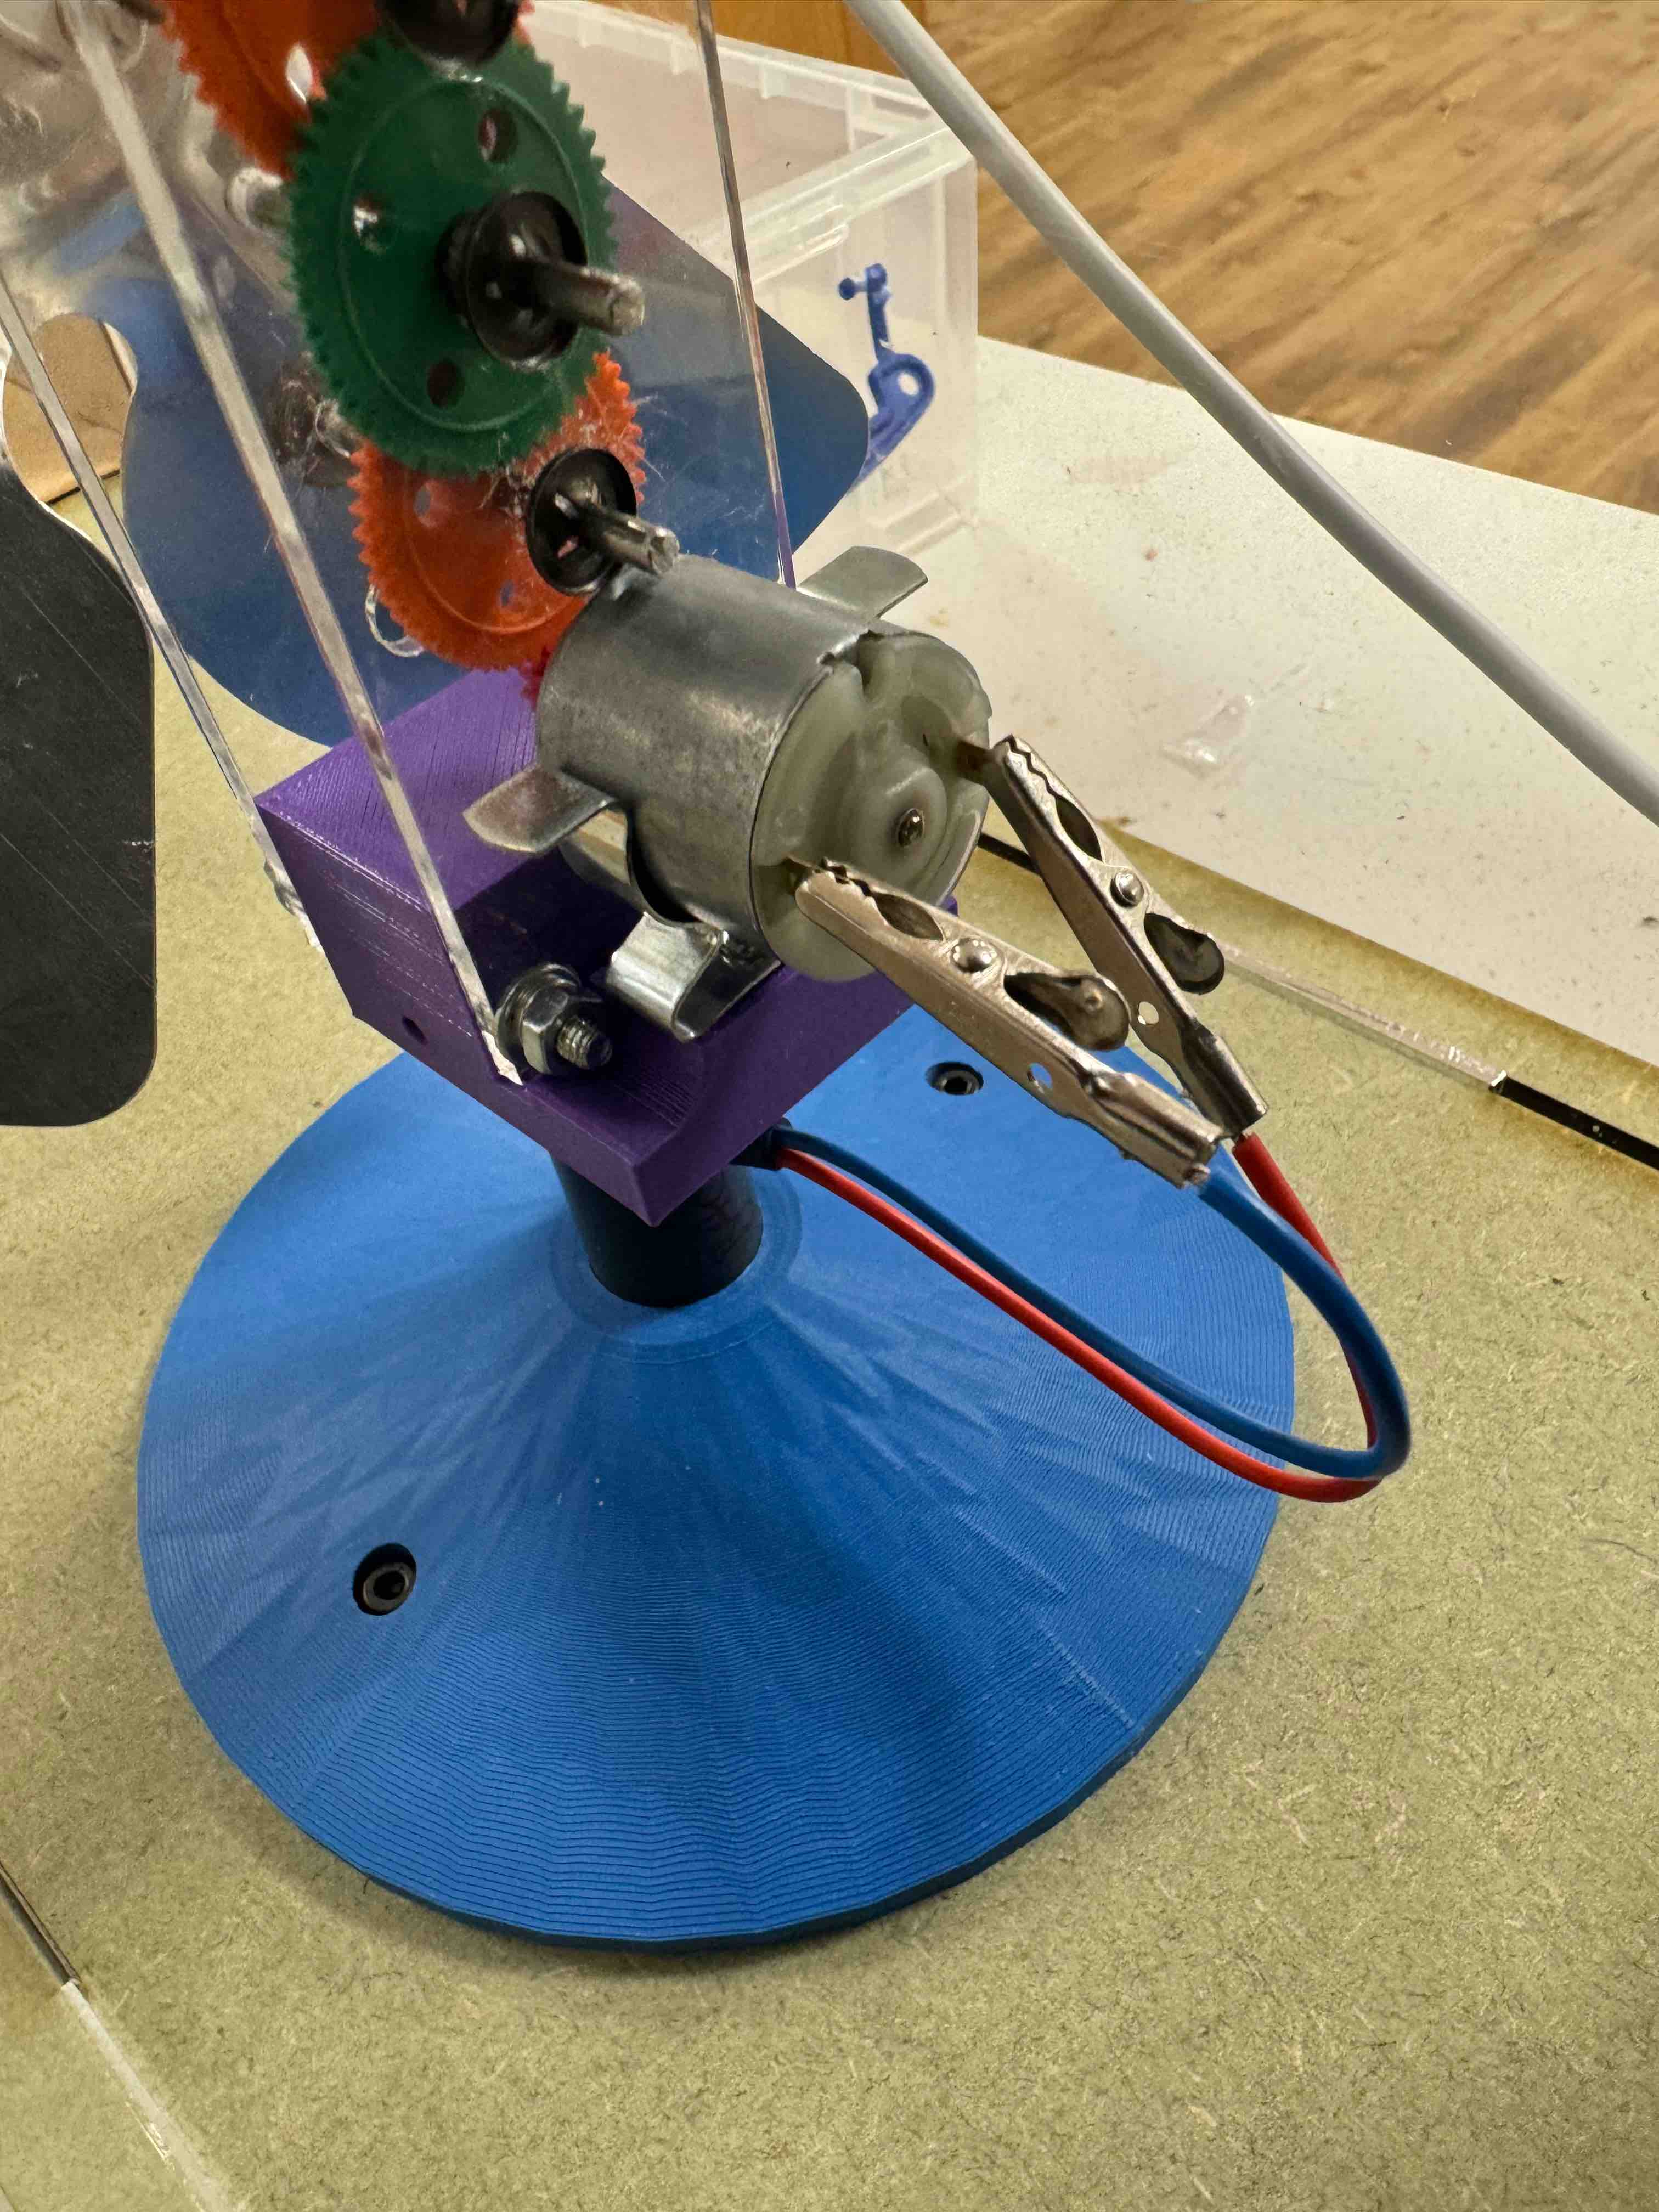
Mounting the wind turbine on the base
The mast is designed to be easily mounted on the base. After placing the mast, use the allen key to tighten the screw(s) to ensure that it does not rotate during operation. Once that is done, the two crocodile clips should be connected to the outputs of the motor to allow its output to be measured using the oscilloscope and measurement software.
Connecting the circuit
Your circuit (resistor and capacitor) must be set up on the breadboard ready for testing. There are three different connections you need to consider:
- Output from motor: This can be connected to the binding posts on the breadboard and wired to the circuit.
- Input to the measurement software
- Input to the oscilloscope

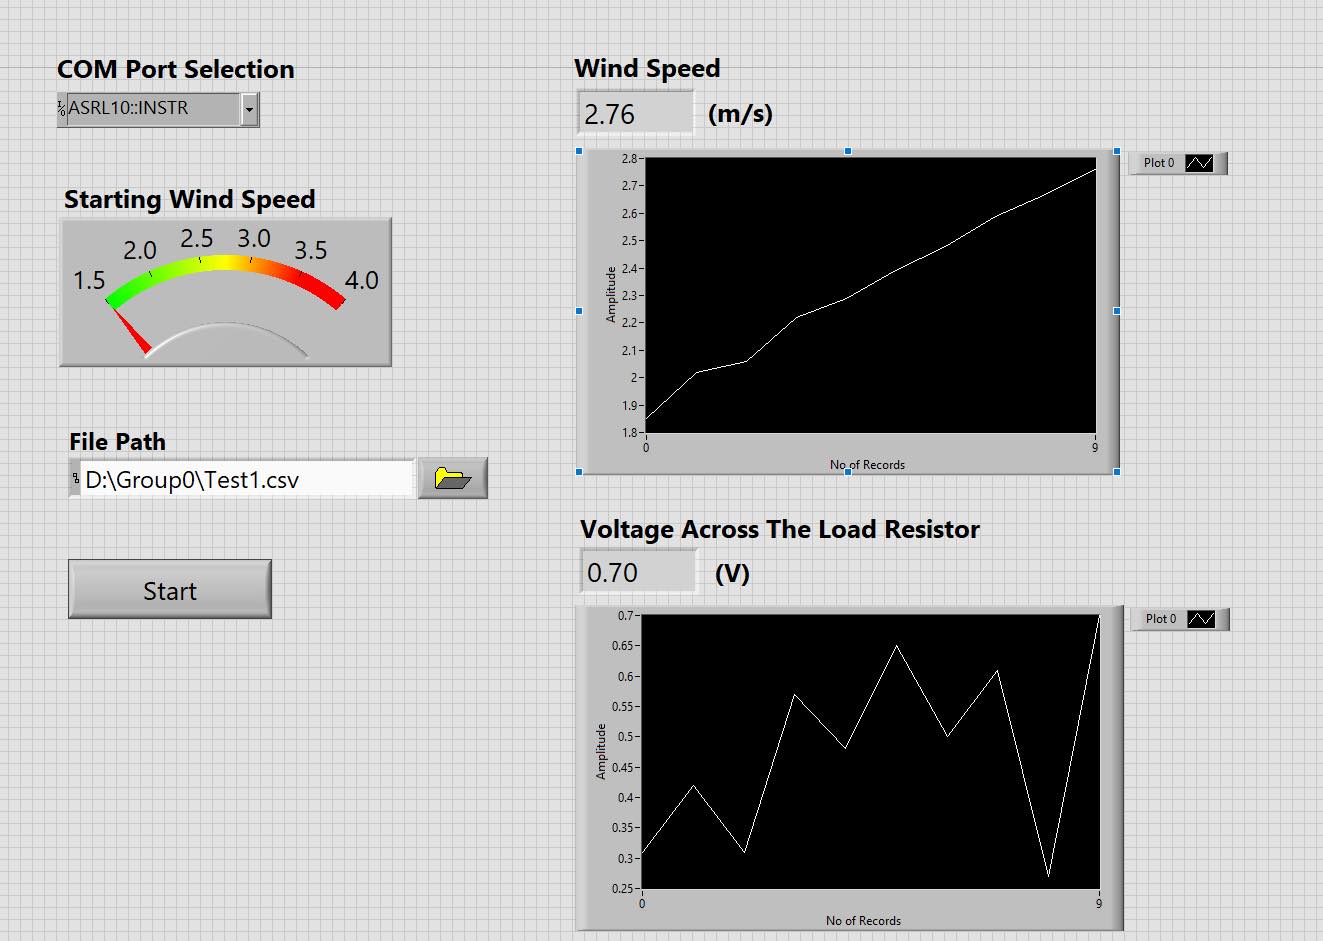
Collecting data using the measurement software
The measurement software outputs voltage measurements at a range of increasing wind speeds. Before starting testing, make sure you are saving to the correct place by changing the file path to include the correct group number and selecting a suitable file name that ends with “.csv”.
You can access the saved data using this link.
Collecting data using the oscilloscope
While the measurement software gives you snapshots of the voltage at various wind speeds, the oscilloscope provides richer information about the generator output. For example, you will be able to assess how “smooth” the output is. Furthermore, exporting the waveform to a csv file allow you to use MATLAB to calculate the energy generated. Below are the steps you can follow to export the oscilloscope data to a csv file.
- It is good practice to start with resetting the oscilloscope to factory settings to ensure a standardized starting point, which eliminates any residual configurations that might affect the accuracy and consistency of the measurements. To do this, click on the
Default setupbutton ->Factory Default->Okay - Ensure you set the probe settings to be 1:1 (or other based on the probe you wish to use).
- Select a suitable window size. This is what determines the length of time you are saving to the csv file. This is done by adjusting the horizontal axis. There are 10 divisions, so choose your division size accordingly. For example, 100 ms divisions will result in a 1 second recording.
- Adjust the saving settings
- Click on the
Save/Recallbutton ->Save->Format setup - Use the entry knob to select the option to save as csv and press on it when you’re done
- To adjust how many points you want to save within the entire saved time go to
Settings->Length. For example, 100 will save 100 points which results in one point per 10ms (if you are following the same settings mentioned above). Increasing the number of points saved increases the time needed for the file to be generated.
- Click on the
- When you are happy with the settings click on
Press to saveor theSave to USBbutton above the trigger knob to save the file. - You may wish to save multiple times during the test run as the wind speed changes. Remember to note down the wind speed at every time you save
Calculating total energy harvested
To calculate the energy harvested from your wind turbine, you will need to use the voltage data collected during the experiments, which is provided in a CSV file. Given a specific load, the process will focus on determining the power over time and then integrating this to find the total energy harvested.
Step 1: Import Your Data
Load the CSV file containing the voltage data into MATLAB. This data represents the voltage generated by the motor across the given load at different times.
Step 2: Calculate Current
Ohm’s Law $V = IR$ will be used to find the current flowing through the load. Rearranging this equation gives $ I = \frac{V}{R}$, where:
- $V$ is the voltage across the load,
- $R$ is the resistance of the load,
- $I$ is the current through the load.
Step 3: Calculate Power
The power at each time point can be calculated using the formula $P = VI$, where:
- $P$ is the power,
- $V$ is the voltage across the load,
- $I$ is the current through the load.
Step 4: Integrate Power Over Time
To find the total energy harvested, integrate the power over time. The integral of power with respect to time will give you the energy in joules (J):
$\text{Energy} = \int P \, dt $
Since you have discrete data points, you can use the trapezoidal rule or a suitable numerical integration method to find the area under the power-time curve. As you have already learned how to obtain the area under a curve in MATLAB (Programming structure lecture in week 3), apply that knowledge to calculate the total energy harvested.
By following these steps, you’ll be able to compute the energy harvested by your wind turbine under the given load conditions, aiding in the analysis and comparison of different turbine designs.
Assessment Criteria
On the final day, the groups will be ranked based on the total power harvested in 30 seconds.