In this exercise we are revisiting some of the techniques used in the earlier workshops, and expand these to include protein structure modelling.
Steps involved in this workshop
1. Find homologous protein sequences
3. Editing sequence alignments
Starting with a protein sequence, you can find similar sequences either by searching by name using Entrez as we did in workshop 2, or by searching with a sequence using a program such as BLAST which we did in workshop 1 and will repeat here.
Our example sequence is that of Bacillus licheniformis nitroreductase:
>B.licheniformis nitroreductaseGo to the BLAST home page : http://blast.ncbi.nlm.nih.gov/Blast.cgi
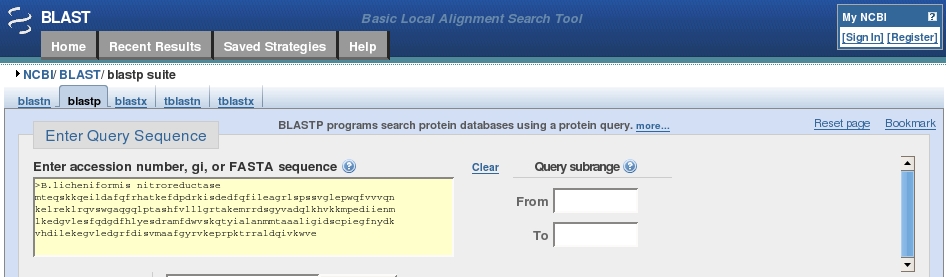
We are going to search the protein database, this being more specific (20 amino acids) than searching with DNA sequences (4 bases) so choose the protein blast option under Basic BLAST about halfway down the page.
Click in the search box, below the Entry Query Sequence header and Paste your protein sequence into the box.
The box should now look something like this:
Leave the Database choice (under Choose Search Set) as Non-redundant protein sequences (nr) (from all databases).
Click the  button to
search the database for similar
sequences.
button to
search the database for similar
sequences.
A new screen appears telling you your protein search has been queued, and the “request ID”. A little later it will also display any conserved domains identified through sequence similarity.
When, at last, the results arrive, at the top of the page is the "conserved domains" chart originally shown on the previous page. Clicking on this chart gives more detailed information in a new window:
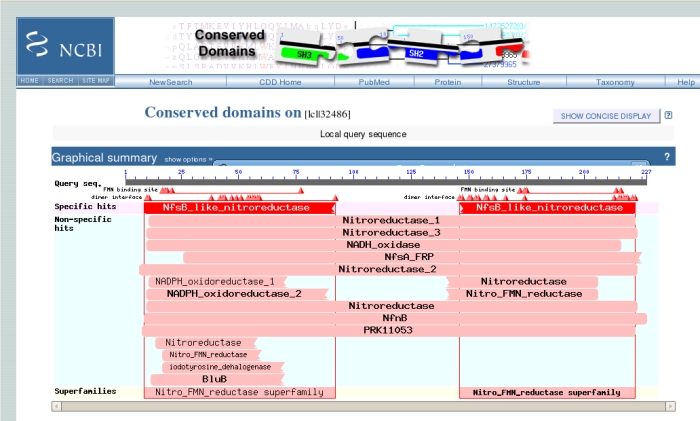
The uppermost grey bar represents the sequence you submitted, underneath which the triangles represent important binding residues. Below these, the large red bar shows that the sequence has a high level of similarity with the NfsB-like Nitroreductase family, which we knew. Hovering the mouse over any of the triangles or bars underneath gives more information. Clicking on the bars gives another screen with sequence alignments and trees of related sequences.
Back on the main results page the next section shows a graphical representation of the 100 most similar sequences from the database overlaid on our query sequence.
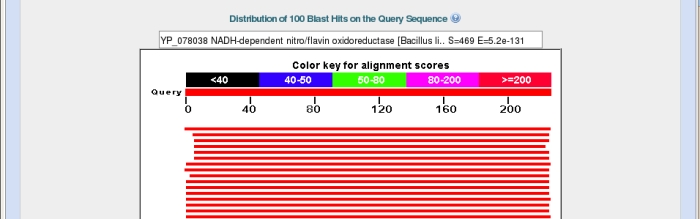
Again the top bar represents the sequence submitted, with the bars below representing matched sequences, coloured by the alignment score, with red being the highest. The length of the bar indicates the region over which there is similarity with the sequence you submitted. In the example above I have hovered my mouse over the top bar to bring its description up in the box at the top.
Below this chart come the names of the 100 similar database sequences (called "hits"), listed in descending scores of similarity.
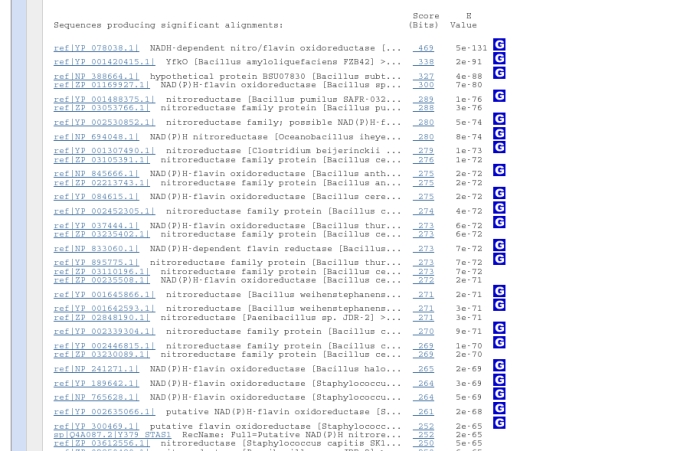
The most important score to look at for similarity is the E-value, which describes the goodness-of-fit of a random sequence, relative to the hit. i.e. the lower the E-value, the better the fit of the hit to your sequence, so the top result is the sequence we submitted. A more detailed explanation of E-values is given here
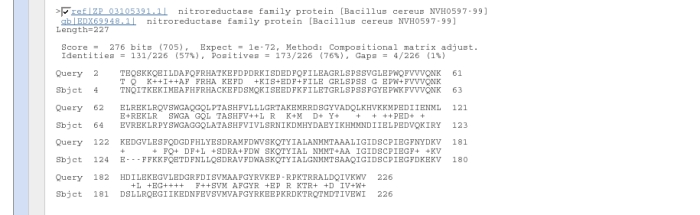
Further down the results page are given the alignments of the database hits against the query sequence.
Choose five or six of the proteins from this bottom part of the results page by clicking in the boxes to left of the sequence identifier, i.e.
A
new page appears listing the sequence ID and a short description.
Change the format
to FASTA in the Display box at the top of the page:
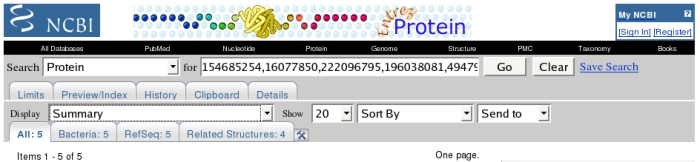
to show the sequences. It is easier to copy them to another website if you then change the Send to box to Text to show the sequences without coloured headers.

To align these sequences we’re going to use T-Coffee, one of several multiple sequence alignment programs available on the European Bioinformatics Institute www.ebi.ac.uk, a site that offers many useful utilities. (T-Coffee can be found under Proteins on the Services pulldown menu)
Clicking on the T-Coffee listing (on the ebi site above) takes us to a submission form. First put the B.licheniformis sequence at the top (so it is included in the alignment), then copy all the sequences from the NCBI BLAST page into the box at the bottom of the T-Coffee page and hit Run.
After a while a Results page appears. You can save the alignment you've created by right-clicking on the the hyperlink to the right of the Alignment File e.g.

and then on Save Target as. In the next popup window change the name to e.g. nitrate_reductase.aln, the file type to All Files, and save it to your H: drive.

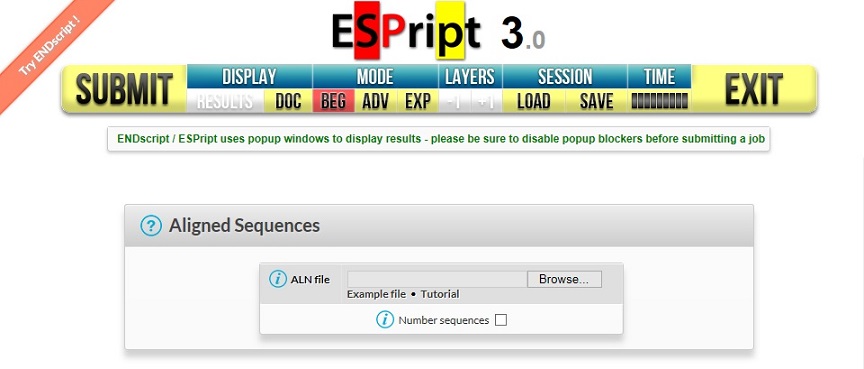
At the top of the site it warns you to allow it to open pop-ups on your screen. To do this, (in Internet Explorer) select Tools, then Pop-Up Blocker, then Pop-Up Blocker Settings. In the Pop-up Blocker Settings window, type the ESPript address (espript.ibcp.fr) into the allowed box then click Add. Now we can continue...
In workshop 2 you were able to annotate your sequence alignments with secondary structure because one of your sequences corresponded to a known structure. You probably haven't any of these this time, so just put your sequence alignment file in the Main Alignment File box.
 on the top toolbar. A link will appear
in a new RESULTS
window, clicking on the PDF link in which
should
show you your output.
on the top toolbar. A link will appear
in a new RESULTS
window, clicking on the PDF link in which
should
show you your output. This can be done on the BLAST site as we did in workshop 1, however you've asked to use the PDB site itself.
Go to the PDB website. In order to search for structures with similarity to a known sequence you need to click on Sequence above the search box.
Then paste the protein sequence from the top of this page into the box, this time without the header line. Another pulldown menu appears, asking which significance level you would like to use for the search. Choose the most stringent, you can always lower it if you get too few results. Then click the search button.
At
the top of the results page are a number of Tabs, catagorising the
matches found by a
number of different criteria

The
first tab corresponds to the 39 structures found, these are
shown on the
first results page presented in order of E-value
as on the
BLAST website. However
there are also 13 papers in the literature, and
28 different ligands bound to these
structures. The final two tabs
group the structures together in terms of their fold, by
clicking on
either you find out that the majority of the results contain both alpha
and
beta secondary structure
and fall within an NADH oxidase family.
Back
on the Structure Hits page, for each similar structure a quick
visual
indication of the quality of the alignment is given by the bar
below the thumbnail
sketch of the structure, the longer it is, the
better the match, also indicated by the
colour. The BLAST statistics
and sequence alignments are also given.
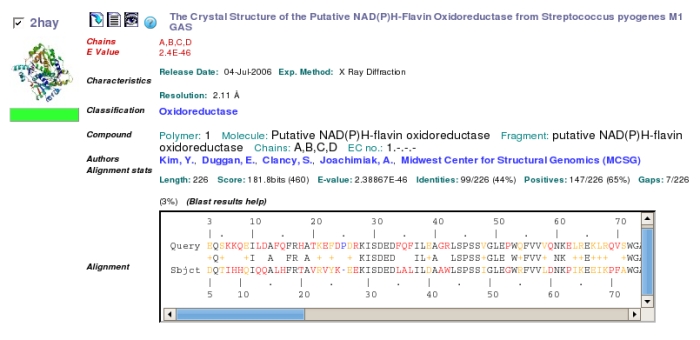
Clicking on the
thumbnail structure or the title brings up a page with much more
detail,
from which the structure can be downloaded or viewed.
Now we have a sequence alignment indicating conserved residues and we know that there are stuctures that share significant sequence similarity with the B. licheniformis nitroreductase. The simplest way of modelling a structure where there is significant similarity to those in the PDB is to use Swiss-Model.
The SwissModel web page is broken into three panels, the main one initially providing a overview of the program, the lower left one giving more detailed help on aspects of the program, and the top left providing links to the possible modelling programs. We’re going to use the most simple, (n.b. in a detailed modelling project this would need to be followed with some of the other options). Click on First Approach Mode in the top left panel.
At the top of the frame put in your e-mail address and the title of your modelling session (something meaningful by which you’ll recognise the e-mail!). Then copy the B. licheniformis nitroreductase sequence from the top of this page into the sequence box.
Then Submit Modelling Request.
Another window appears, which tells you that your job has been submitted, then running. and finally the results appear in the window.
The first stage in the modelling was "Template Selection". If you scroll down to this section of the website:
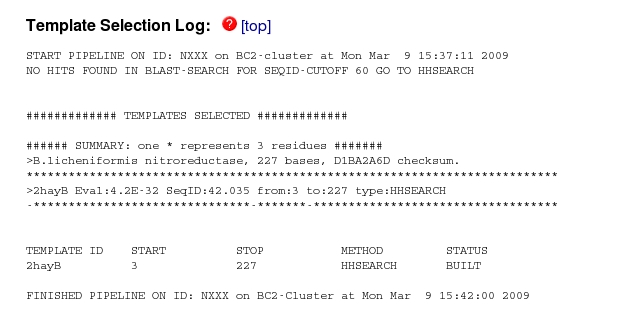
you can see that no hits were found with more than 60% sequence identity, but one (2hayB) was found with 42% identity. This is the B molecule in the pdb entry 2HAY, which was also the top hit in your BLAST search of the PDB which is reassuring.
Just above this section of the website is the Modelling log which gives details of the modelling process, which may not be of interest at this stage in your knowledge of protein structure modelling. More useful may be the Evaluation section, which illustrates graphically which sections of the model may be reliable.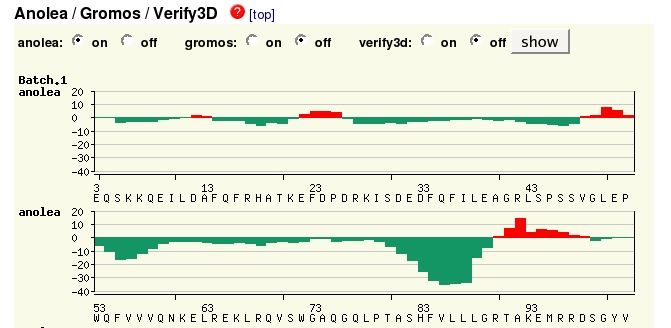
By
default the Anolea method is shown, assessing the environment of each
residue, green being favourable, red unfavourable. (There is more
information about all the plots if you click on the  links
at each section.) Here
you can see that the model isn't perfect in several regions.
links
at each section.) Here
you can see that the model isn't perfect in several regions.
Just above this is the sequence alignment, a good sequence alignment is crucial to an accurate model. So to improve this model you could try to optimise the alignment in the unfavourable areas of the plot and use your own alignment in another cycle of modelling.
At the top is the model itself, together with some important information, the amount of the sequence that was modelled, the template on which it was modelled and the BLAST statistics for that model. If you click on the picture, a simple viewer will appear, allowing you to visualise the model coloured from blue at the N-terminus to red at the C.
The coordinates of the model can also be downloaded, allowing you to view it in a more powerful viewer such as Rasmol or Deep View (also written by the Swiss Institute of Bioinformatics), in order to look at conserved residues identified from your multiple sequence alignment, or putative active site residues in more detail.
During these workshops you have used: