And below we see the zoom plot. Note that only elements falling entirely within the zoom area are plotted.
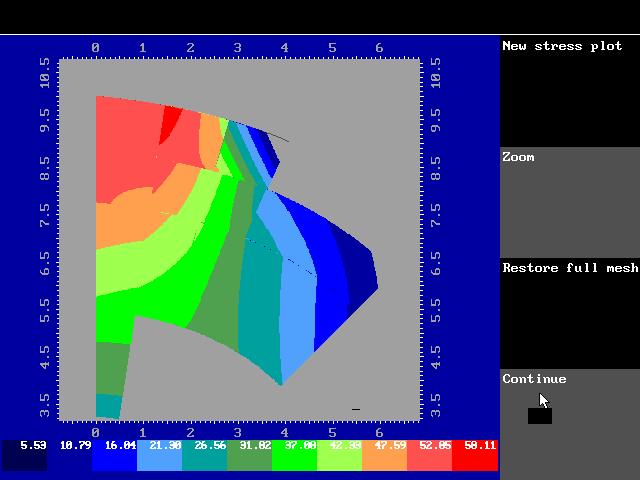
Note that the stress contours are plotted from the Gauss-point values element-by-element, with no attempt to smooth stresses for inter-element continuity. The user casn thus see, by the jump in stress, that the mesh needs to be refined further between the first and second rows of elements.
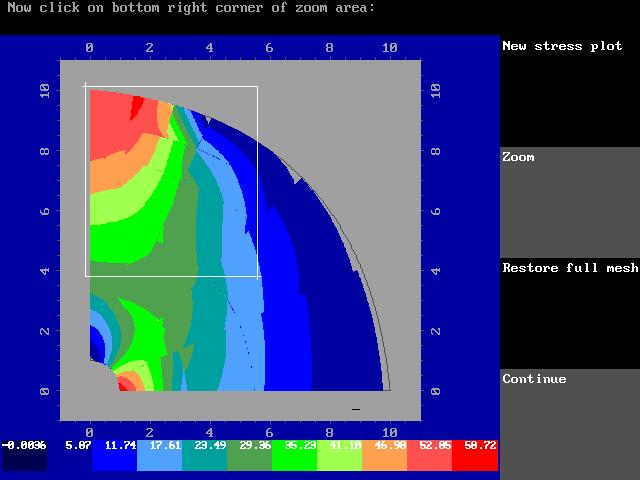
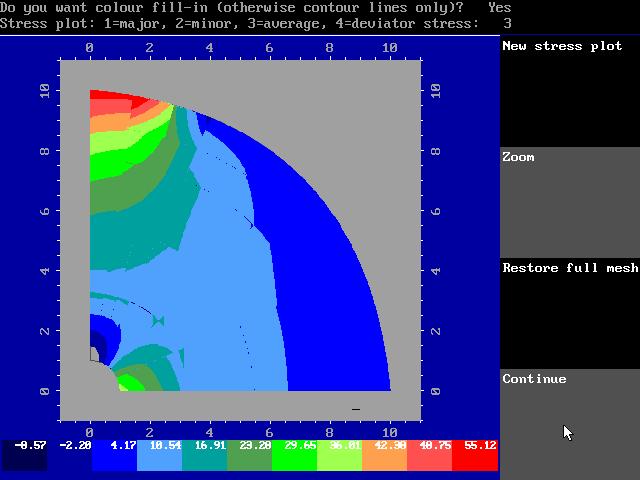
The final picture for this example shows a contour plot of average stress (s1 + s3)/2.
The final page shows results from analyses using a nonlinear material model.