Diode Circuits
Introduction
This practical experiment involves building basic diode circuits on a breadboard and making observations and measurements on them.
Half-wave rectifier
Build the circuit in on a breadboard. Note that the cathode end of the diode is indicated by a black circle on the body of the diode’s case as illustrated below. Use the signal generator to input a 20V peak-to-peak, 2kHz sinewave. Connect the oscilloscope channel 1 to view the source voltage and channel 2 to view the capacitor voltage. Use the ‘scope Acquire menu to view the average of 16 waveforms to get cleaner waveforms.
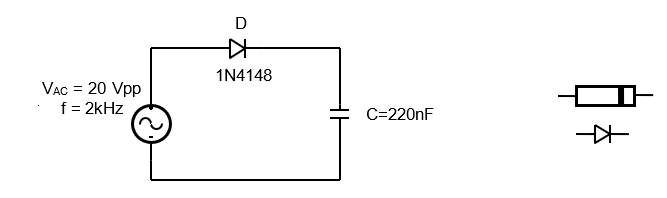
Exercise 1a
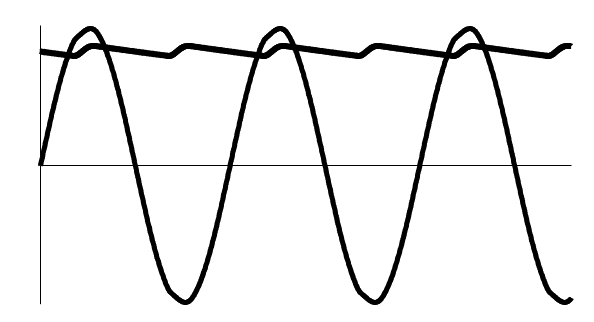
On the same axis sketch two cycles of the input and output voltage waveforms. Measure and record the peak input and output voltage levels using the oscilloscope cursors.
Exercise 1b
State and explain what happens to the output voltage when VAC is reduced.
Exercise 1c
What is the difference between the input-peak and output DC voltage and why does this difference occur?
Clamper circuit
Build the circuit in on a breadboard. Use the signal generator to input a 20V peak-to-peak, 2kHz sinewave. Connect the oscilloscope channel 1 to view the source voltage and channel 2 to view the diode voltage. Use the ‘scope Acquire menu to view the average of 16 waveforms to get cleaner waveforms.
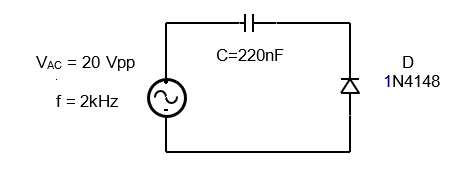
Exercise 2a
On the same axis sketch two cycles of the input and output voltage waveforms. Measure and rec-ord the peak input and output voltage levels using the oscilloscope cursors.
Exercise 2b
State and explain what happens to the output voltage when VAC is reduced.
Exercise 2c
Do the troughs of the waveform lie at exactly 0V? If not, what is the minimum voltage they fall to and briefly explain why?
Half-wave rectifier
Build the circuit in on a breadboard. Use the signal generator to input a 20V peak-to-peak, 2kHz sinewave. Connect the oscilloscope channel 1 to view the source voltage and channel 2 to view the resistor voltage. Use the ‘scope Acquire menu to view the average of 16 waveforms to get cleaner waveforms.
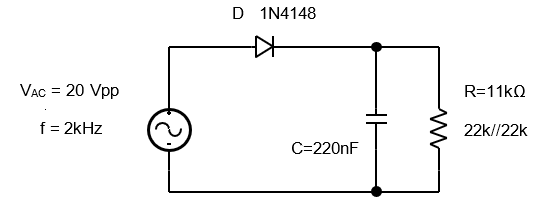
Exercise 3a
On the same axis sketch two cycles of the input and output voltage waveforms in a similar manner to . Measure and record the peak input and output voltage levels using the oscilloscope cursors. Note that the slight distortion of the positive peak of the sine-wave voltage arises because of the 50Ω source resistance of the signal generator.
Exercise 3b
Measure and record the value of voltage ripple in the output waveform.
Exercise 3c
Estimate voltage ripple using $i = C \frac{dv}{dt}$ or $I = C \frac{\Delta v}{\Delta t}$ and by assuming that the capacitor supplies a constant load current of $I = \frac{V_{\text{AC-peak}}}{R} $ between voltage peaks or for time $T = \frac{1}{f}$.
Full-wave rectifier
Build the circuit in on a breadboard. Use the signal generator to input a 20V peak-to-peak, 2kHz sinewave. Connect the oscilloscope channel 1 to view the source voltage and channel 2 to view first the top of the resistor with respect to with respect to the source 0V terminal, and then the bottom resistor voltage with respect to the source 0V terminal.
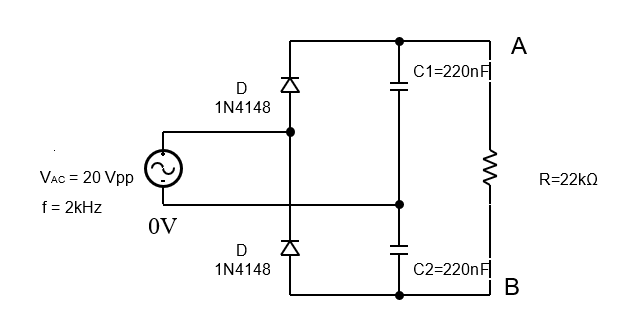
Exercise 4a
On the same set of axes, sketch on top of a source sine-wave voltage sketch two cycles of the:
- capacitor $C_1$ voltage waveform.
- capacitor $C_2$ voltage waveform. Using the oscilloscope cursors, measure and record the peak output-voltage and the output-voltage ripple. Add these values to your waveform sketch.
Exercise 4b
Use the oscilloscope Math button to get a $v_{AO} -v_{BO}$ waveform, i.e., complete output-resistor voltage waveform. Sketch this waveform and measure the peak-to-peak ripple.
Exercise 4c
How does the value of output voltage across the $22k\Omega$ resistor and its voltage ripple compare with the measurement made in Exercise 4a?